
For this week’s Infographic I created a map that shows the most populated Vermont counties to the least populated. I … More
Tag: canva
Sea Turtle Anatomy
The program I used to create this was Canva. I started this from scratch. Sea turtles are my favorite animal … More
Diagram of an Alto Saxophone
For this assignment, I decided to start from scratch on canva. I wasn’t completely sure what I wanted I to … More
My Favorite Duck Donut Combinations
I took “the subject matter is virtually limitless for this diagram” and ran with it. For the layout of this … More
The Human Heart….Diagram
For this assignment I chose to do a diagram of the human heart. To create my infographic I decided to … More
Pictorial
For this pictorial diagram, I chose to do a simple house. I found the picture on freepix.com and used canva … More
Employment Statistics for Montoursville, PA
I used Canva for the design of this Infographic and Google Sheets for the graph. I used Canva’s free icons … More
Type 1 Diabetes in America
I used Canva again to make this infographic. I used another template to start my infographic but I changed the … More
Common Alcohol in Calories
For this assignment of Charts and Graphs I actually decided to use Canva this time. At times having trouble with … More
Alzheimer’s Infographic
For this infographic, I used canva again because it is something I am familiar with so I wanted to use … More
Top Five Grossing Movies of 2019; Avengers, Lion King, Star Wars, Frozen II, and Toy Story 4, Claim Victory
For this second graphs and charts infographic, I decided to switch up the topic and create them on The Top … More
Population Statistics of Montoursville, PA
For this assignment, I decided to use the United States Census website to gather data for the 2018 population of … More
Stress in America
For this assignment, I used Canva. I chose a template to use but only kept the background elements and the … More
US Firearms Infographic
For this infographic, I pretty much started from scratch on canva. I did use a template, but ended up deleting … More
Statistics on Social Media Usage
When I first began to think of an idea to research social media came to my mind immediately. I would … More
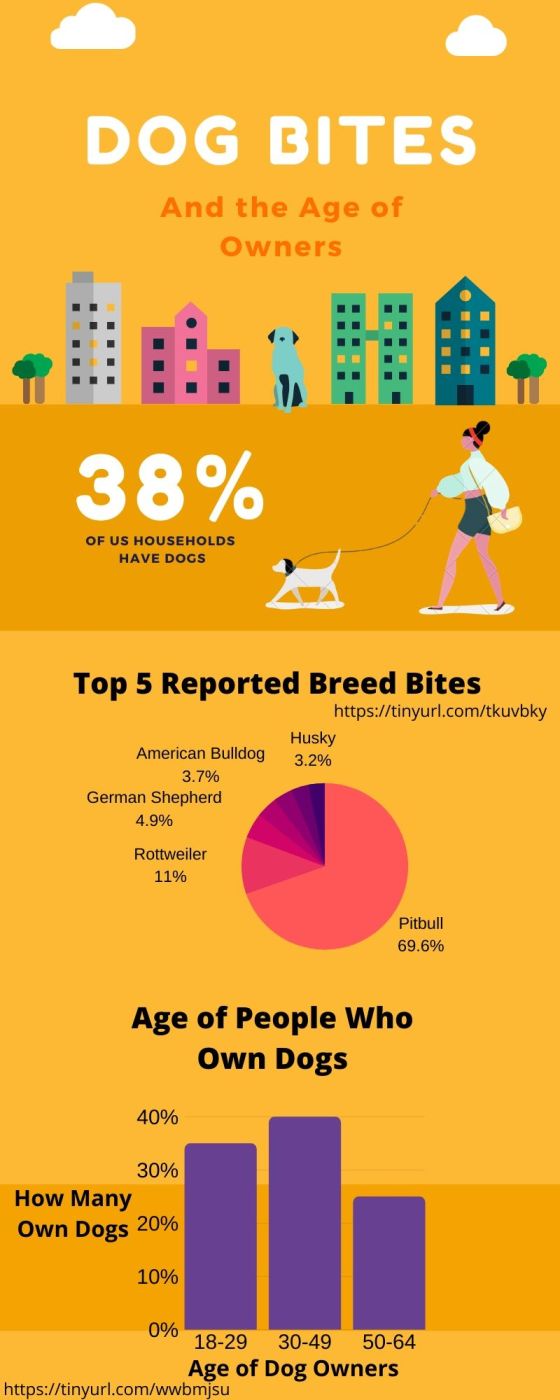
DOGS: Who owns them and who’s biting
When deciding what kind of data I wanted to show, my mind went straight to my favorite thing in the … More
The Thin Blue Line: Pennsylvania Line of Duty Police Deaths in 2019
I decided to complete this graphs and charts infographic on Pennsylvania Police who were killed in the line of … More
Charts and Graphs- Broadway
I chose to do my charts on Broadway shows since this is part of my major, as well as … More
Introducing Fiona Salvatori
For this infographic, I decided to use a template on Canva.com. Canva has some awesome templates to choose from, and … More
Getting to Know Princess Mia Thermopolis
For this Profile Infographic assignment, I started from scratch on creating a profile on Princess Mia Thermopolis. Growing up and … More
