Design a site like this with WordPress.com
Get started
Skip to content
Bloomsburg Infographics

Bloomsburg Infographics

A space for BU students to showcase their work

  • About

Tag: kali

How Broadway Has Changed: The Hamilton Effect

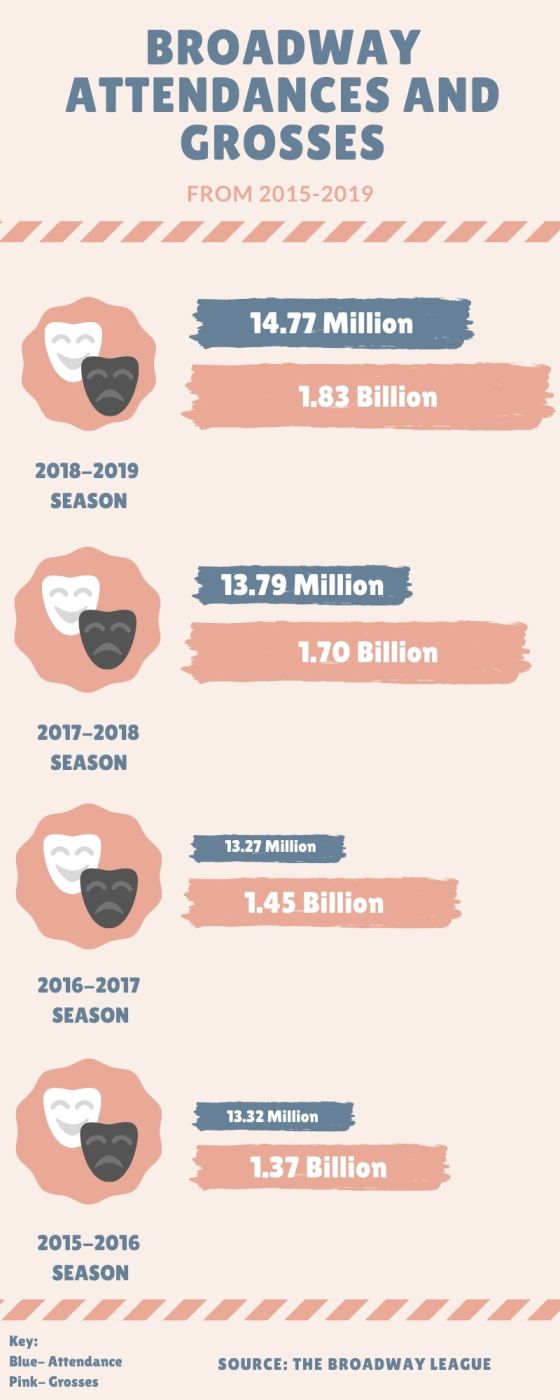
Broadway has always been an integral part in entertaining the public, especially in New York City. It brings in millions … More

broadway, Hamilton, kali, nyc, the hamilton effect

Swipe Right on COVID Dating

Online dating during the Corona Virus pandemic has become wildly popular, more so than ever before. People are using dating … More

bumble, Covid-19, kali, online dating

AL WORDEN

For this week, I chose to do the story on Al Worden, the astronaut who died recently. I used canva … More

al worden, astronaut, facts, kali, NASA, Science

Tim Burton’s Famous Films and the money they grossed

For this section, I chose to do Tim Burton, who is my idol and one of my favorite directors. I … More

beetlejuice, kali, movies, nightmare before christmas, tim burton

CoronaVirus vs. The Flu

For this week’s topic, I chose to do the CoronaVirus vs the flu. I just put a few quick facts … More

coronavirus, flu, infographic, kali, WHO

Democratic Primary Results as of March 17th, 2020

For this infographic, I chose the democratic primary results as of March 17th, 2020. I used Canva for this project … More

democrat, democratic primary, election, infographic, kali, Politics

Average Price of One Ticket to Broadway Shows

For this graphic, I used Canva. I picked a template and changed the subject of it and rearranged some things. … More

broadway, infographic, kali, theatre, ticket

Eastern PA Map

This map is eastern PA’s counties and their populations. I was going to do all of PA, but that was … More

#kali, Counties, kali, map, PA, Photoshop

Theatres in Western PA

This map is a detailed outline of some theatres/ theatre companies in western PA! They range from Harrisburg to the … More

#kali, googlemaps, infographic, kali, map, masscomm

Pictorial

For this pictorial diagram, I chose to do a simple house. I found the picture on freepix.com and used canva … More

canva, diagram, infographic, kali, pictorial

Graphs and Charts: Round Two!

For this assignment, I used Canva and easel.ly. I found this assignment to be a bit harder than the last, … More

#graph2, #line, #radar, infographic, kali

Charts and Graphs- Broadway

  I chose to do my charts on Broadway shows since this is part of my major, as well as … More

broadway, canva, chart, charts, kali, music, theatre

Personal Infographic

For this first assignment, I did an Infographic on myself! I used Canva.com and I used a template. I scrapped … More

canva, infographic, kali, personal, theatre

Categories

  • Arts and Entertainment (46)
  • Economics and Money (47)
  • Education (38)
  • Food (12)
  • Health and Environment (97)
  • Infographics (330)
  • Media and Technology (73)
  • News (25)
  • Pennsylvania (21)
  • Politics and Elections (48)
  • Science (28)
  • Sports (24)
  • World (38)

Recent Comments

Dorothy's New Vintag… on Leading a Heart-Healthy L…
dlsrcamerahandle on DSLR Camera Button Functi…
ruthiesbbq.wordpress… on New Data is in About College E…
ashlynburkholder on The Many Ice Cream Shops of Ge…
Jeff Cann on The Many Ice Cream Shops of Ge…
Create a website or blog at WordPress.com
Privacy & Cookies: This site uses cookies. By continuing to use this website, you agree to their use.
To find out more, including how to control cookies, see here: Cookie Policy
  • Follow Following
    • Bloomsburg Infographics
    • Join 224 other followers
    • Already have a WordPress.com account? Log in now.
    • Bloomsburg Infographics
    • Customize
    • Follow Following
    • Sign up
    • Log in
    • Report this content
    • View site in Reader
    • Manage subscriptions
    • Collapse this bar
 

Loading Comments...