Design a site like this with WordPress.com
Get started
Skip to content
Bloomsburg Infographics

Bloomsburg Infographics

A space for BU students to showcase their work

  • About

Tag: broadway

How Broadway Has Changed: The Hamilton Effect

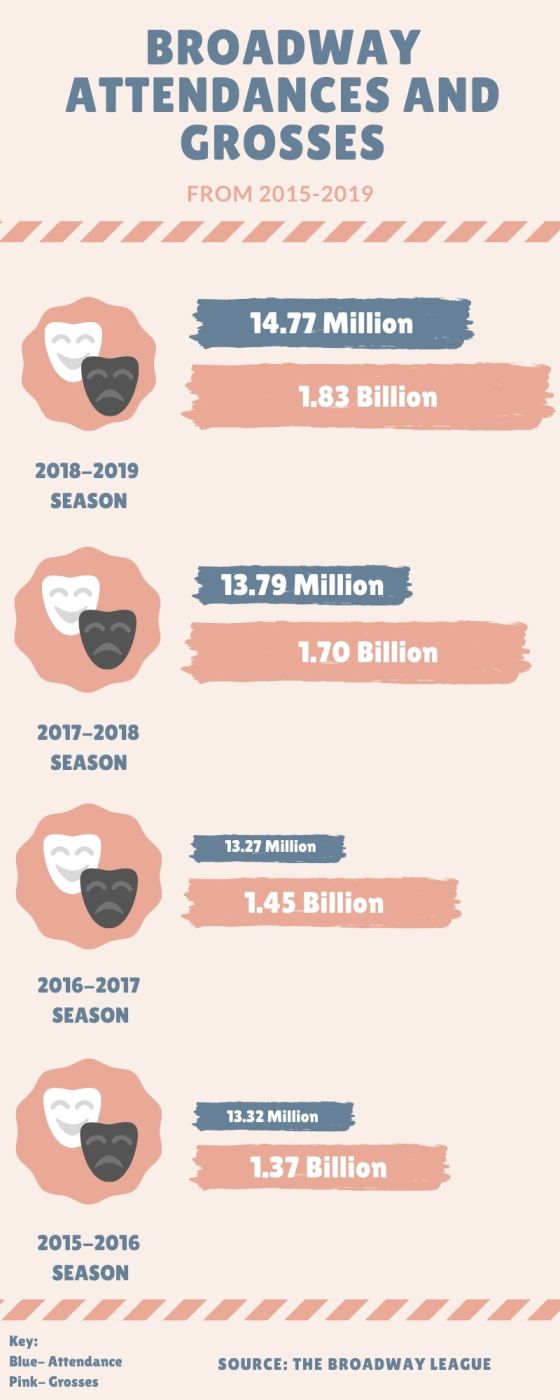
Broadway has always been an integral part in entertaining the public, especially in New York City. It brings in millions … More

broadway, Hamilton, kali, nyc, the hamilton effect

Average Price of One Ticket to Broadway Shows

For this graphic, I used Canva. I picked a template and changed the subject of it and rearranged some things. … More

broadway, infographic, kali, theatre, ticket

Charts and Graphs- Broadway

  I chose to do my charts on Broadway shows since this is part of my major, as well as … More

broadway, canva, chart, charts, kali, music, theatre

Categories

  • Arts and Entertainment (46)
  • Economics and Money (47)
  • Education (38)
  • Food (12)
  • Health and Environment (97)
  • Infographics (330)
  • Media and Technology (73)
  • News (25)
  • Pennsylvania (21)
  • Politics and Elections (48)
  • Science (28)
  • Sports (24)
  • World (38)

Recent Comments

Dorothy's New Vintag… on Leading a Heart-Healthy L…
dlsrcamerahandle on DSLR Camera Button Functi…
ruthiesbbq.wordpress… on New Data is in About College E…
ashlynburkholder on The Many Ice Cream Shops of Ge…
Jeff Cann on The Many Ice Cream Shops of Ge…
Create a website or blog at WordPress.com
Privacy & Cookies: This site uses cookies. By continuing to use this website, you agree to their use.
To find out more, including how to control cookies, see here: Cookie Policy
  • Follow Following
    • Bloomsburg Infographics
    • Join 224 other followers
    • Already have a WordPress.com account? Log in now.
    • Bloomsburg Infographics
    • Customize
    • Follow Following
    • Sign up
    • Log in
    • Report this content
    • View site in Reader
    • Manage subscriptions
    • Collapse this bar
 

Loading Comments...