
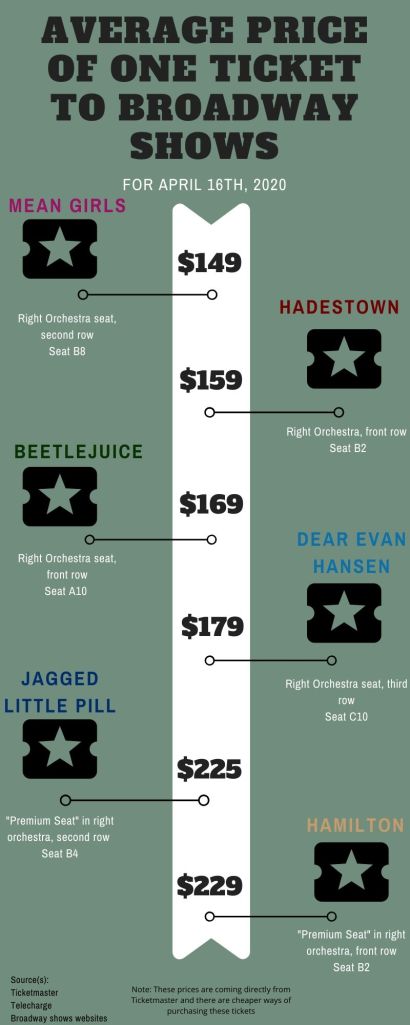
For this graphic, I used Canva. I picked a template and changed the subject of it and rearranged some things. This didn’t take long to research, about an hour or two. I chose this topic because this is my passion, as you can tell from all of my other infographics. For my sources, I used Ticketmaster as well as each individual show’s websites. For the research process, I chose the same section of seats to they’re easier to compare, as stated in the Linked In Learning course I took. I chose seats as close as possible that were available.
