

By: Dyllan Ogurkis
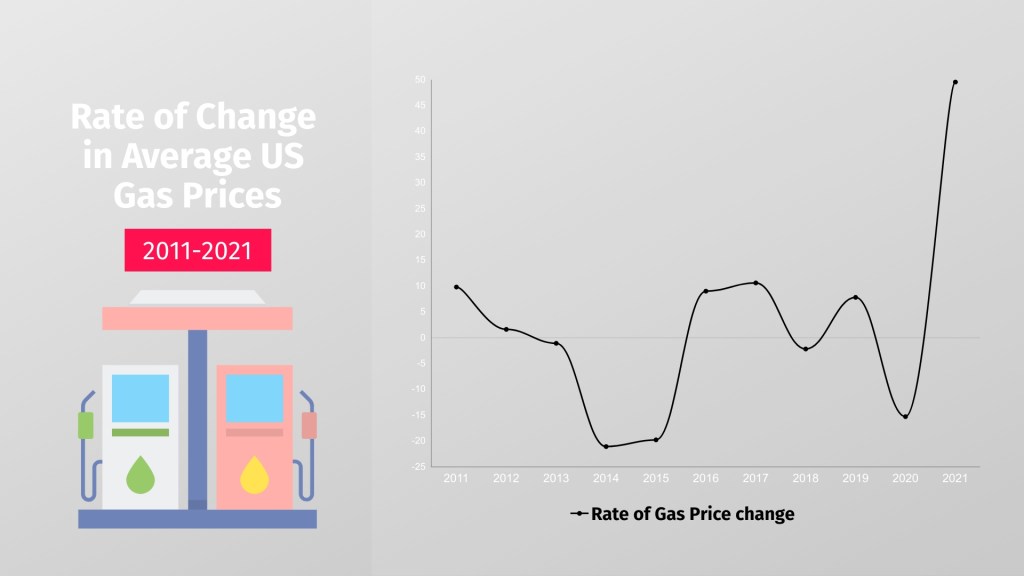
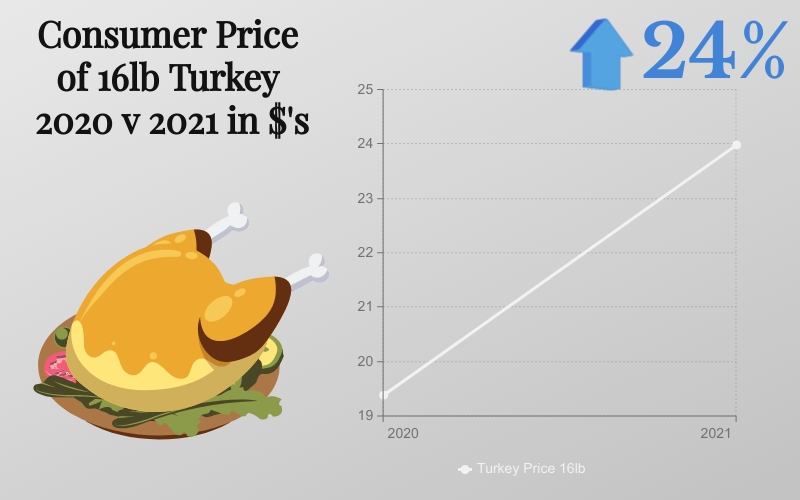
For this infographic, I created the three separate graphics in Visme. All three deal with the inflation rate as well as their effects on consumer goods. The entire folder of infographics took around 3 and a half hours to organize together. I wanted to keep visual effects a main point for these infographics, with that in mind I utilized many different graphics and images both revolving around money and consumer goods well as graphics to symbolize the inflation growth through word art percentages. Supplemental data for these graphics were collected from USA Today, US Inflation Calculator, and the Bureau of Labor Statistics.
