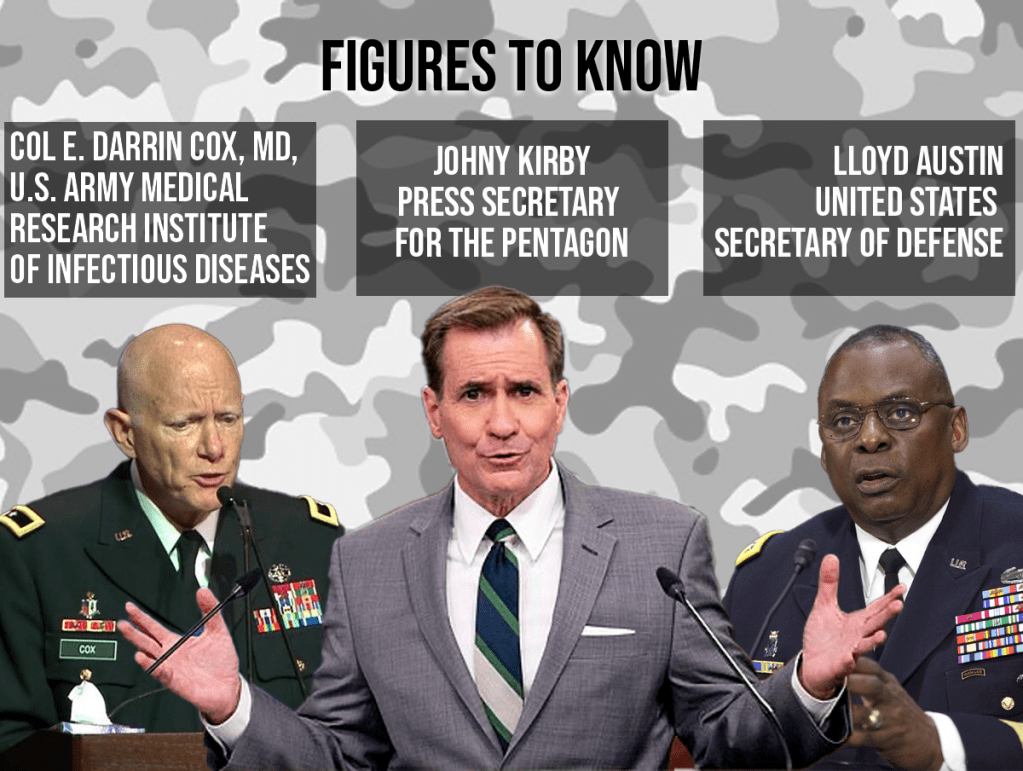
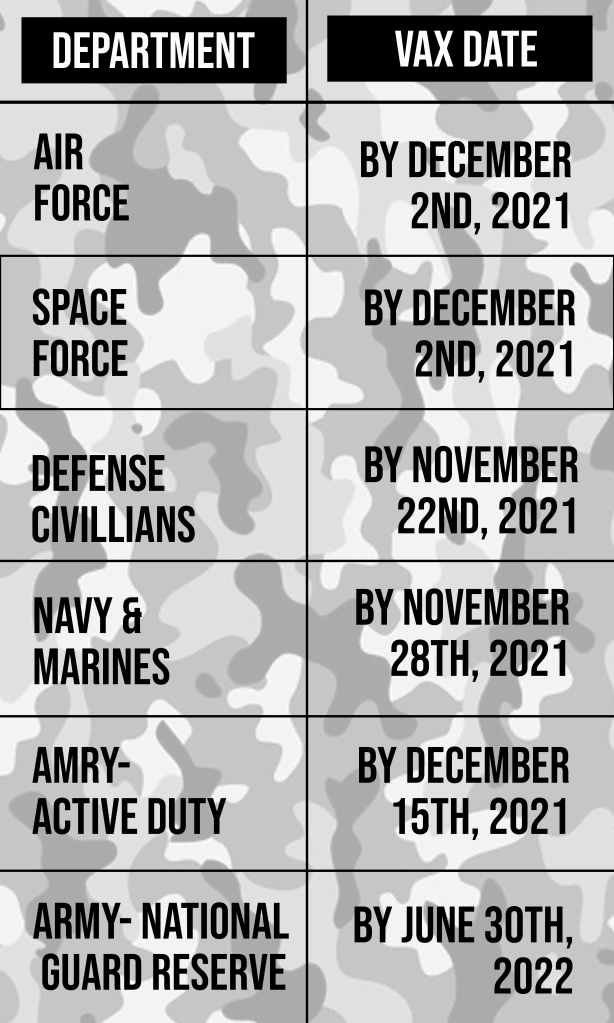
I would places this after the first paragraph so the reader knows who they are reading about and refer back to this illustration.I would put this after the 20th paragraph to give a visual representation of percentages.I would put this at the end of the article because the dates are scattered and if someone wanted a small recap of dates for departments they would have it.
Reflection
I used photoshop again for this assignment. I loved working with photoshop and I especially like the select subject tool is very helpful for cutting things out. I started from scratch for everything.
I wanted to make sure that I had figureheads. When I read things I remember people and recognize their importance if I see their pictures. With the percentages I knew that it would be nice to see a visual representation to see where the military is at with vaccination.
I looked up more updates and pictures.
This took about 5 hours.
I have a tendency to try and make interesting pie charts. I played with opacity for everything and wanted to make it very simple as to not take away from the information.