

This infographic would be placed after paragraph 2 because this paragraph introduces Justice Brett Kavanaugh as the deciding vote in the 5-4 decision to allow the Texas abortion law to take effect. I thought it was important to creat an infographic about Brett Kavanaugh so that people could get some back story on where he’s from, his political party, and when he became apart of the Supreme Court.
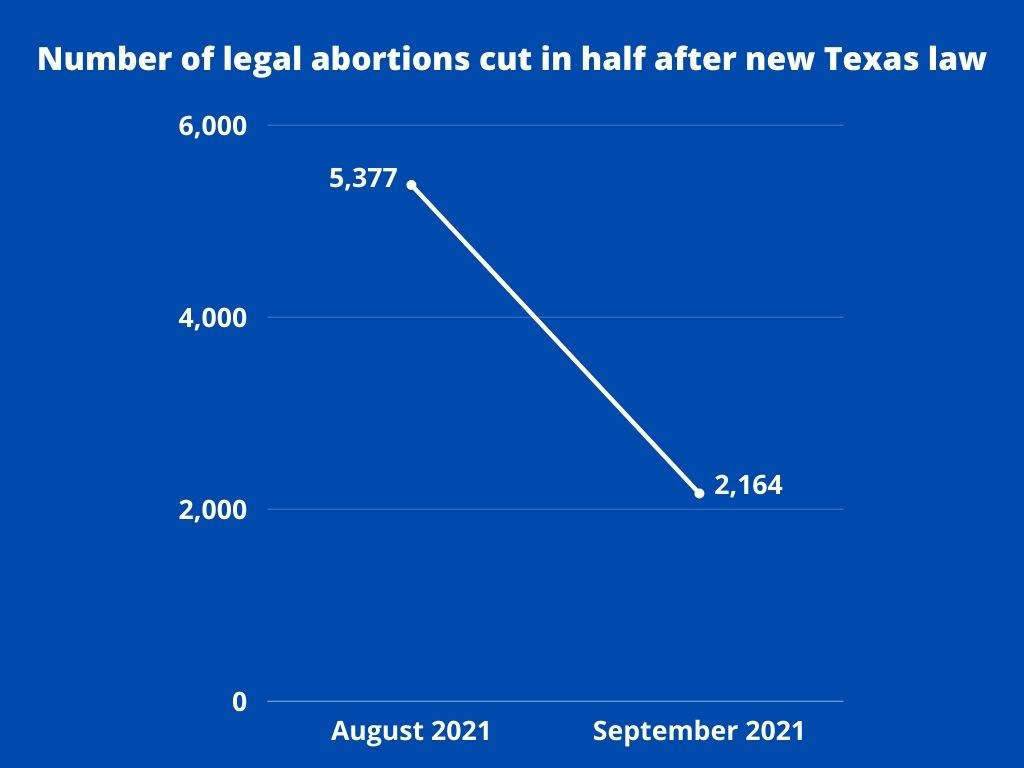
This infographic would be placed after paragraph 12 because this paragraph talks about how in Texas’s new abortion law, abortions are banned after cardiac activity is detected which is normally about 6 weeks. Since many women don’t know they’re pregnant at 6 weeks, I wanted to create a chart which shows the decline of abortions in only one month span after the abortion ban. I think it’s important to put this into perspective for viewers to see the effects on the ban.
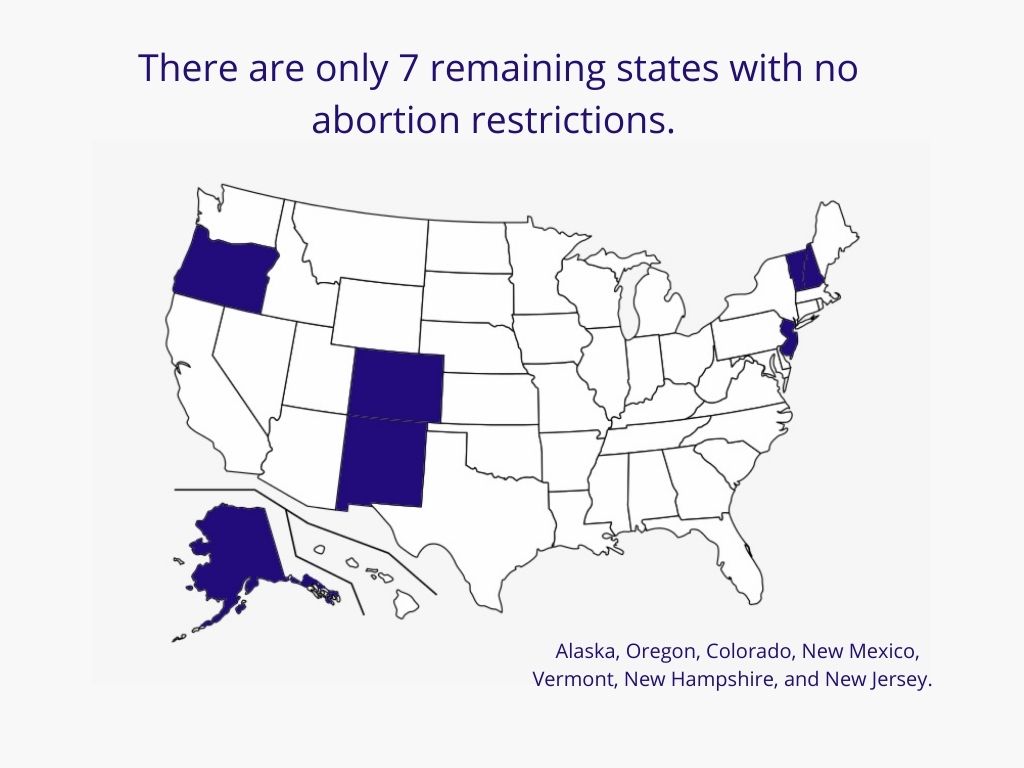
This infographic would be placed under paragraph 14 because this paragraph talks about how 12 other states attempted to put an early pregnancy ban on. I wanted to create this infographic to put things into perspective and show that there are only 7 states left with no restrictions on when women can have abortions.

This infographic would be placed under paragraph 18 because this paragraph talks about the Biden Administration’s opinions on the new Texas ban. I wanted to people reading this article to get a better insight into the current President’s perspective. Also, I wanted to show the huge percentage of people that wanted to get abortions more than 6 weeks of being pregnant and Biden’s thoughts on that.
Reflection
For these infographics, I decided to use Canva since I am most comfortable with using Canva. I decided to start each of these infographics from scratch so that I would have more freedom in creating my infographics. I like the amount of control Canva gives me. The elements of this story that caught my attention were how they showed different perspectives. I also thought it was crazy that there are no exceptions to this law for rape or incest.They introduced the names of the people who voted to put this law in effect as well as the people who disagree with this law. In my opinion, the parts of the story that I wanted to enhance in my infographics was showing the negative effects on women after this law was put in effect and put in perspective that Texas could be the first state out of many. I researched this topic by first reading the article and figuring out what I wanted to show in my infographics. I then researched more in depth about each topic of my infographics to find more information. It took me about an hour to get all of the research that I wanted and another hour or more to create my infographics. Although the infographics don’t have as much on them as previous assignments, I think they help to tell this story and put things into perspective. For my design process, I wanted to use a navy blue background for most of the infographics to keep it simple but also add color. However for the map infographic, I decided to reverse the colors so that it wouldn’t look too busy. I tried to keep the infographics simple but effective.
