
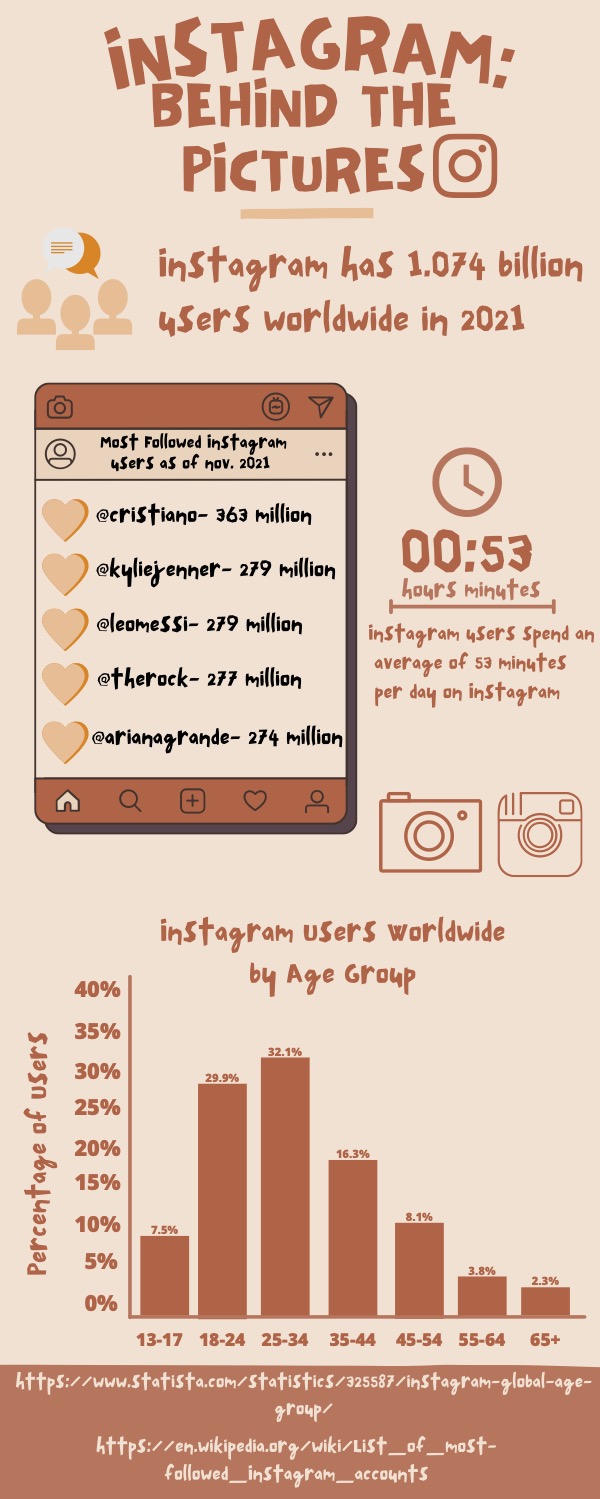
I once again used Canva to create my infographic. I had a lot of different ideas about what I wanted to do, but I thought doing the statistics behind Instagram would be interesting. Instagram is one of my favorite apps, and it’s super popular amongst my age group. There was surprisingly a lot of current statistics and information regarding Instagram. This only took me about 30 minutes to research, then about 2 hours give or take to create. I can tell that I’m getting more comfortable with using Canva. The first infographic I did probably took me 6 hours, but now that I know where everything is, it makes the process a lot smoother.
I really liked all these colors together. I tried to keep it more modern and almost “aesthetic” considering the most popular age group is around my age, so I tried to tie that into this infographic. I took the smaller graphics from Canvas graphic section, and changed their colors around for them to better fit my theme. I made the bar graph from scratch and just used lines and rectangles from Canvas shapes section to do it. While this is a little tedious, it get easier the more you do it!
I had a lot of fun doing this infographic because I was so interested in the topic, which definitely made it a lot more fun to do.
