
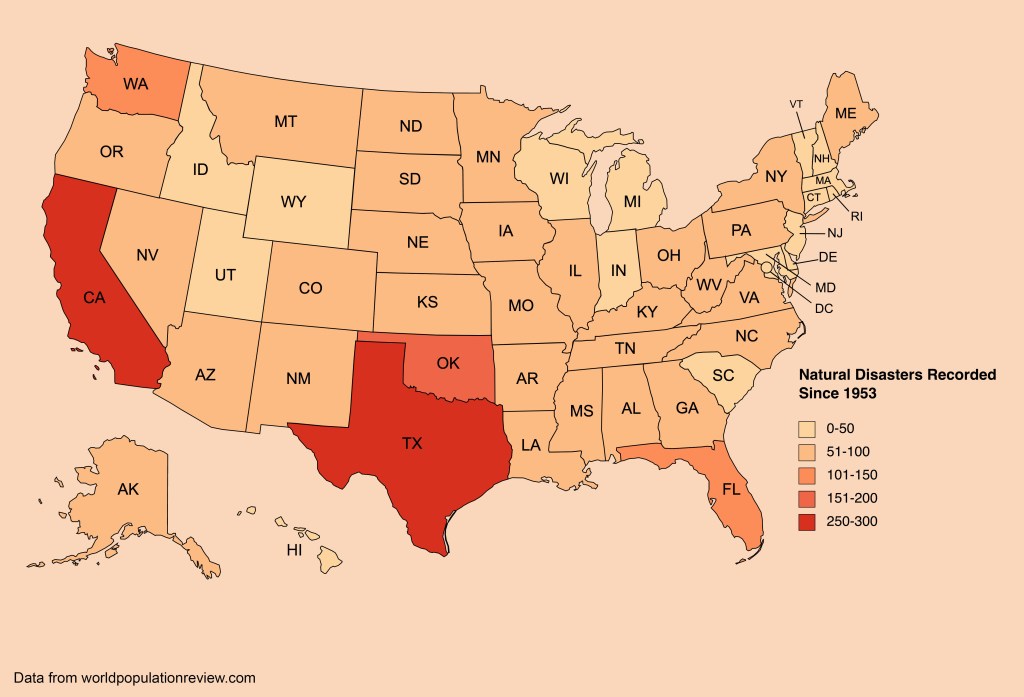
For this infographic I decided to highlight the natural disasters recorded in each state since 1953. I used mapchart.net as a template for my data input. I acquired all of my statistics from worldpopulationreview.com which I also cited in the corner of the infographic. All of my data was compiled into excel and I sorted it to display smallest to largest values. This helped me categorize my values for the legend and decide what color each state would fall into. Once my map was colored I opened it in photoshop and added some finishing touches.
It did not take very long to research, but compiling and sorting the data took about 20-30 minutes of organizing. Once everything was sorted, the rest of the process went very smooth and went by quickly. I chose this color scheme because I feel as though bolder colors like the red highlight areas of more danger. I also think the color scheme is easy on the eyes and allows everything to be seen accordingly.
