
Reflection
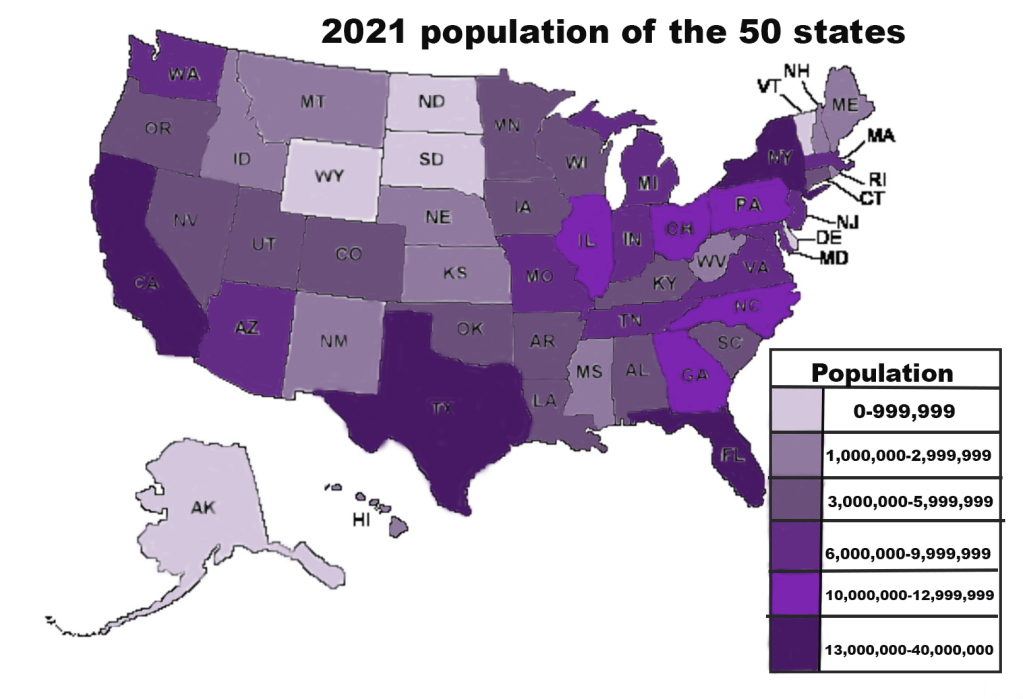
I used photoshop to create this infographic. I didn’t start from scratch because I found a template of the United States. It was my first time making an infographic during this course not using Canva to create the infographic. I liked making this infographic on photoshop but it took me a little longer than other infographics. I researched this topic by just googling the population ranking of the US states in 2021. It only took me about 10 minutes to research this topic but it took me about an hour to create the actual infographic. It took me a lot longer than I thought it would because I had some troubles with photoshop. For my design process, I first downloaded the map and imported it into photoshop. Then, I created a legend and title to add context to my map. Finally, I added the colors to each state onto the map. I chose different shades of purple for my infographic because I wanted to do shades of the same color for a monochromatic color scheme.
