
Reflection
Program:
I used the app datawrapper to create my infographic. I decided to branch out and choose a websit that I have never used before for this project. Datawrapper made it easy to choose an image, insert data, and create a visually appealing map. I liked that this program kept things very simple. It is easy to overthink choices and obsess over every little detail about a map but Datawrapper kept things very organized and it was easy to use.
Research
I chose this topic because it is a stereotype in American that Canadians are very nice and that nothing bad ever happens there. I’ve never seen real statistics about Canadian crime and I was interested in learning. I simply Googled Canadian crime rates and found a reliable website that provided me with quantitative facts.
Design Process
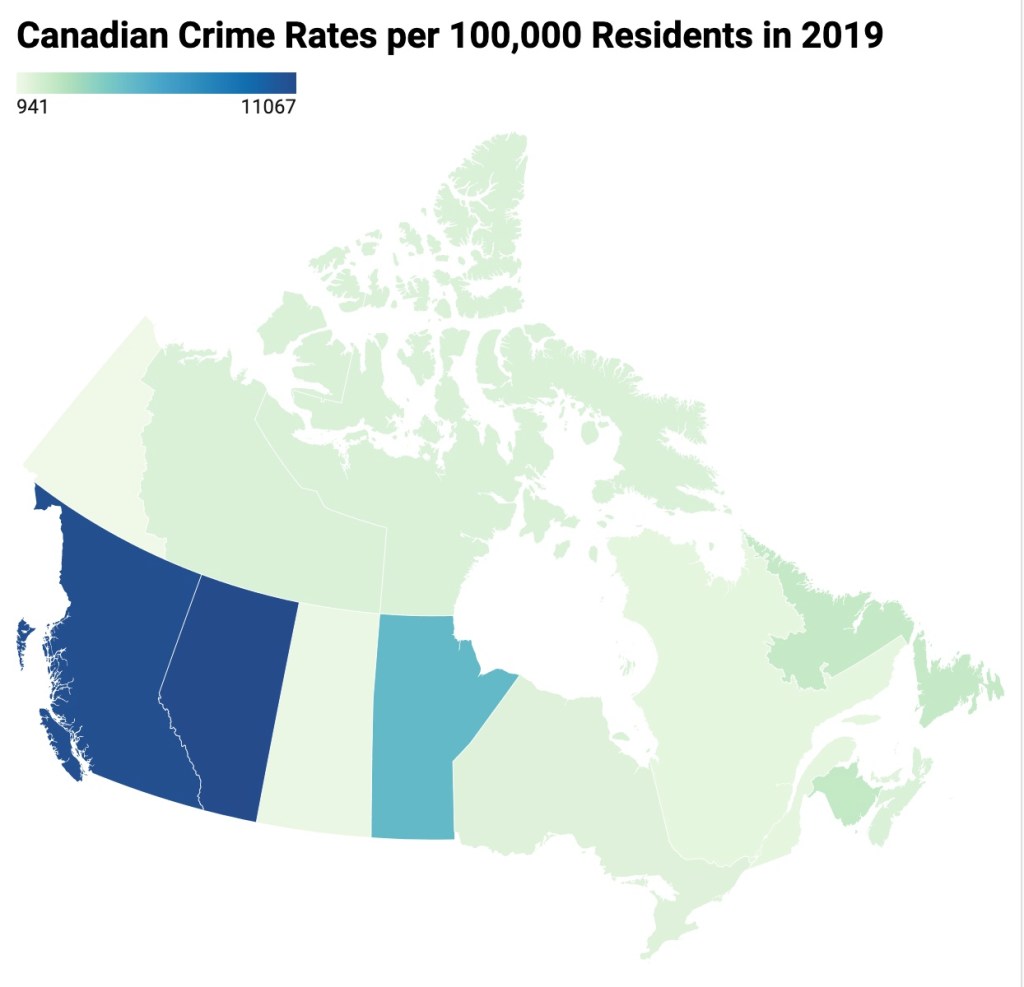
I chose a simple map that only included the shape of Canada because I did not want a lot of text to take away from the key message. I chose the color pallet that I did because I think it is easy to distinguish between the colors and that they are visually appealing. I went with simple black for the color of the title because it is plain and does not take away from the map.
