

For this week’s assignment, I decided to create my graphs and charts on Canva Charts and then I created the infographic on the regular Canva site. The graphs were already a template, however, I created the infographic my scratch. This was my first time using Canva Charts and I found it fairly easy to navigate and not as tedious as Canva. I liked that there were several different templates and I was able to choose from an array of charts.
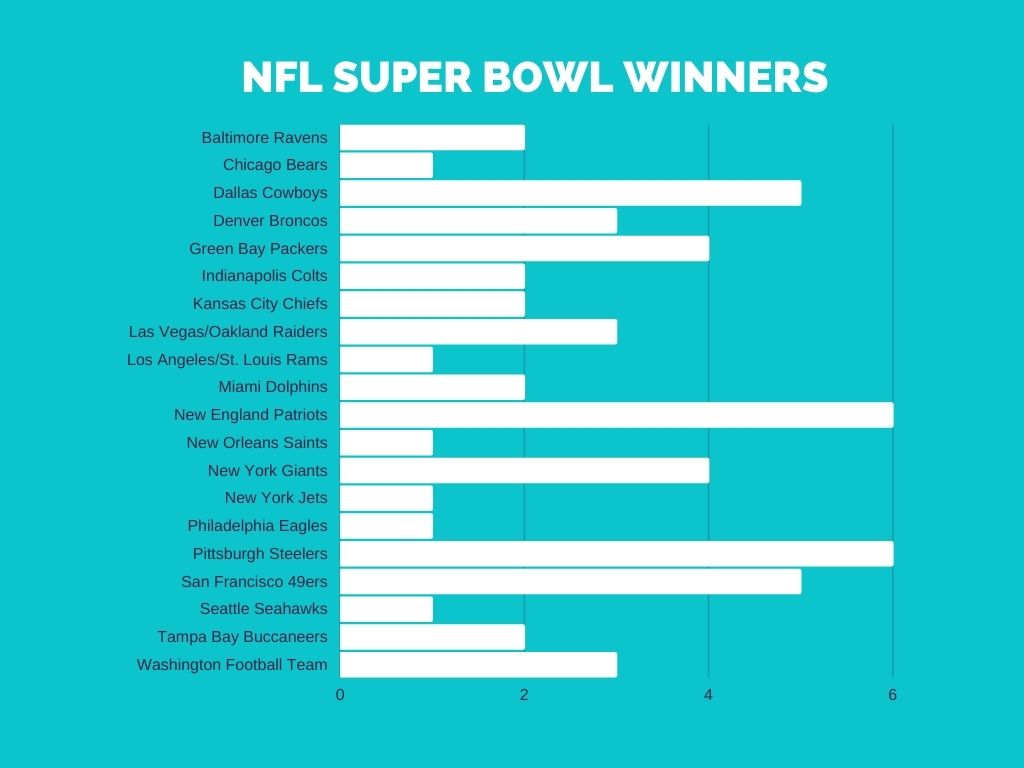
I actually found out a lot of information about the NFL and which teams have won Super Bowls in the past. I was able to learn this information from sites such as ESPN, Sports and Statista. My topic was very easy to research and it only took about a half hour plus another two hours to create my charts and infographic.
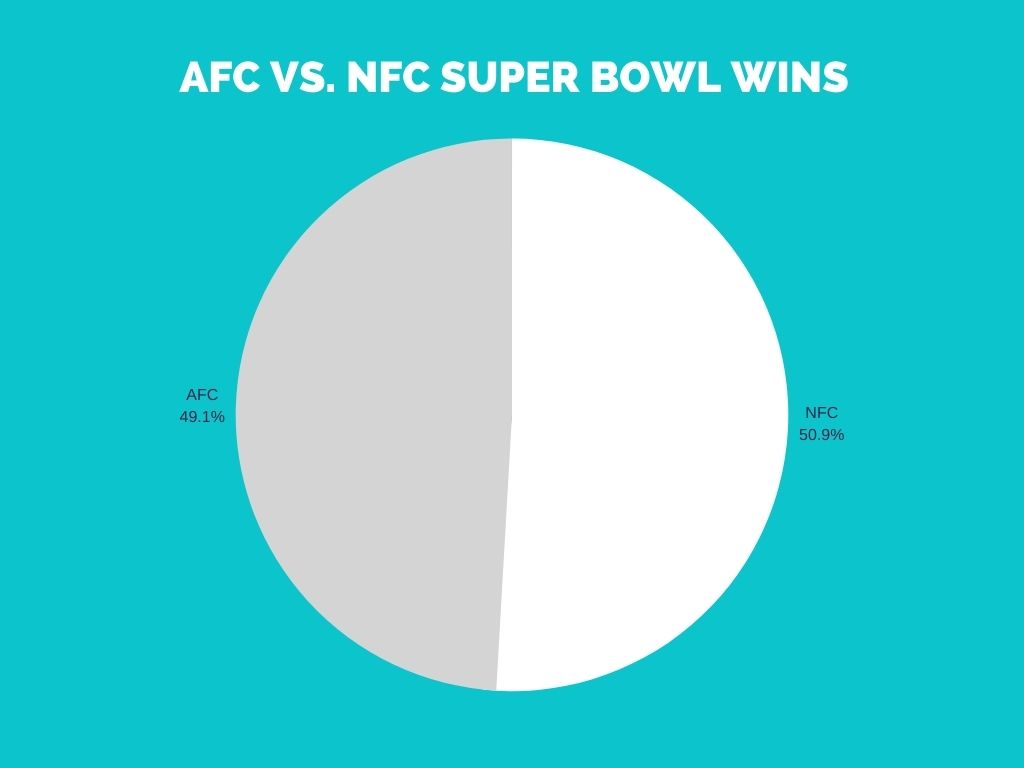
Since the charts were already a template, I kept a lot of it the same. I really liked the bright blue color along with the basic black, white, and gray. I did choose a different kind of bar chart than the one that was originally provided. I just thought that a row chart looked more appropriate than a bar chart. I also chose a pie chart because I think that they are easy to understand and I like that we are able to see the percentages.
