
By: Rachel Iredale
Reflection
Program:
For this assignment, I used powerpoint. On last weeks charts and graphs assignment I used Cavna. I decided to try and use a different program because Canva provides templates and creative ideas, which is great, but I wanted to try and make my own graphs with out any use of templates. I also used power point because I completed the LinedIn learning course on it and wanted to try it out. I liked using power point because I got to use what I learned.
Research:
I did not have to spend too much time researching about the planets. It took about 20 minutes to find all of the information. There is a lot of information out there and it was not difficult to find statistics about the planet sizes and distance. It took me longer to actually make the inforgraphs. I probably spend about 20 minutes on each chart.
Design Process:
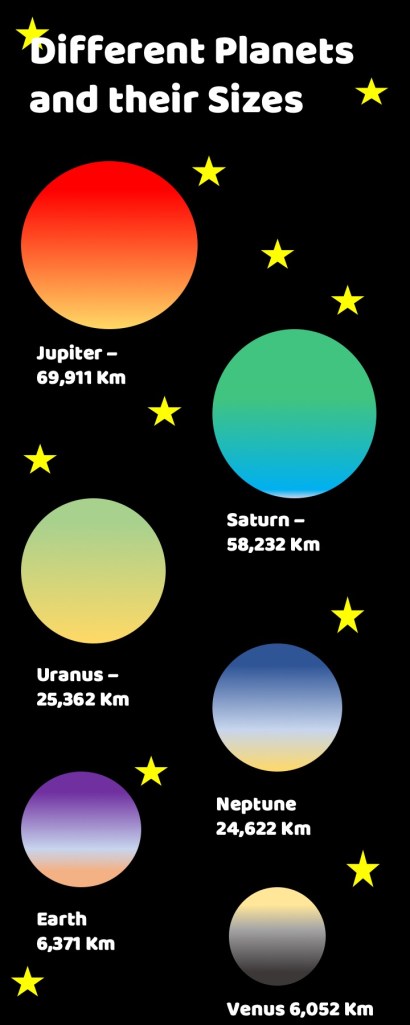
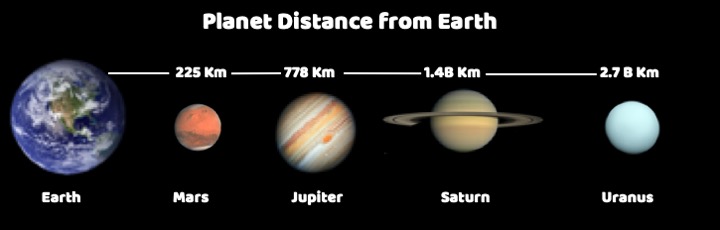
To start, I used what I learned in the LinkedIn course to change he slide dimensions to what I needed them to be. I chose to make the background black to reflect space. I choose the font that I did because it reminded my of the Star Wars font. I used white for the words because it looks nice against the black background. For the plant sizes chart I decided to use the gradient feature to mix colors to create patterns that I think of when I think of the planets. For this week, I tired to be more creative with the type of graphs and charts I made. Last week I focused on more of the traditional sense of graphs, like pie charts and bar graphs. This week I attempted to show scale with the different sizes of the plants and I showed distance by making the distance graph horizontal and lining the planets up in order.
