
Program
For the program, I chose Canva. I use Canva for my residence life job, so I’m very familiar with it. I like Canva for its colors and variety and spacing tools. This program is user-friendly and gives me endless creativity.
Research
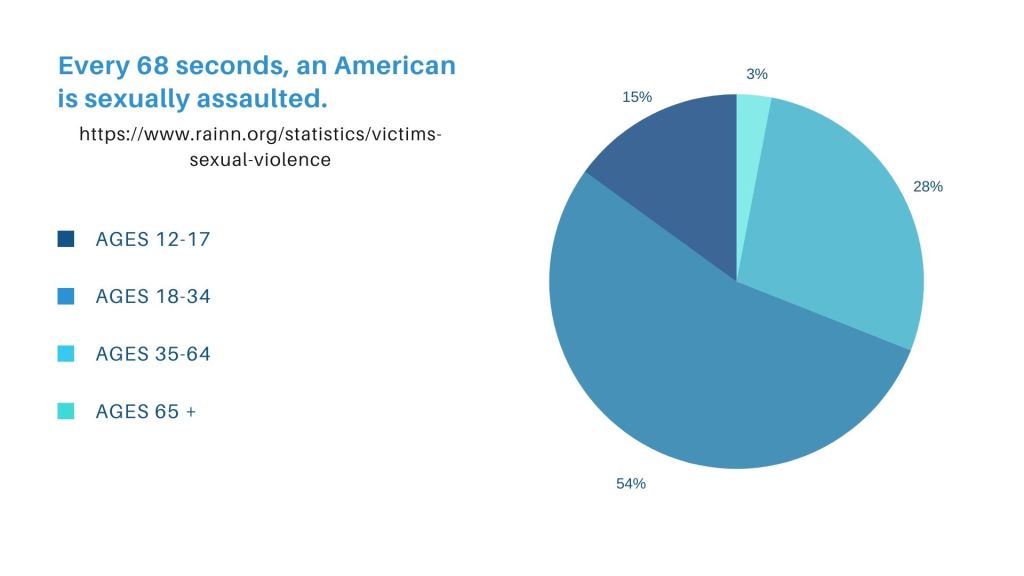
I chose a topic I cared about recording. I researched statistics through trusted organizational websites dedicated to this cause. I looked at their infographics and listed information and based mine off of that. Most of the information was helpful and very interesting. I did not want to copy their infographics but it definitely inspired me in regards to future infographics.
Design process
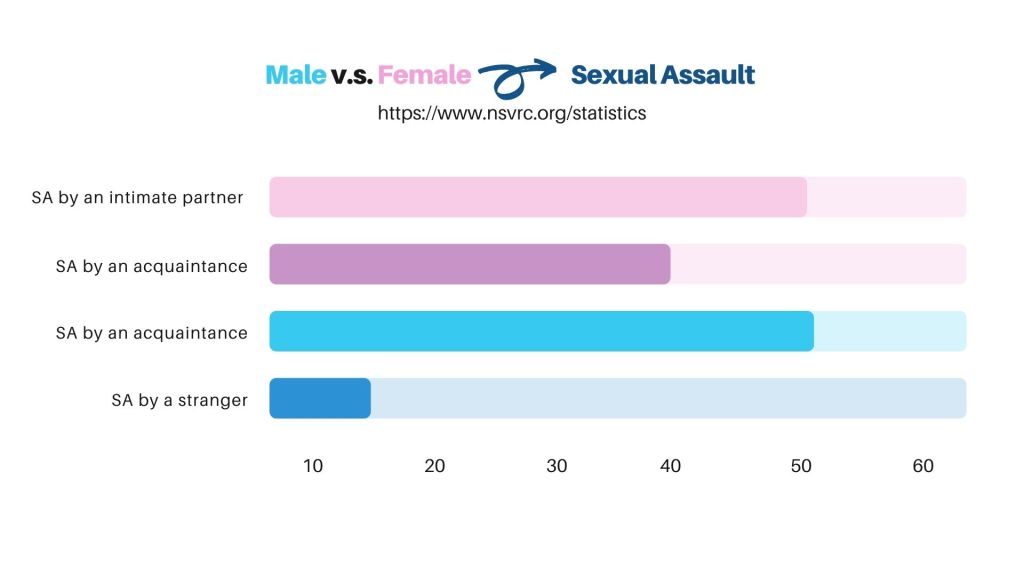
My design process had a lot to do with simplicity. I feel like with a topic as heavy as I chose, simple colors and design would be best. The bar graphic was very fun to make and I enjoying playing with templates and elements. I added the arrow for a touch of fun and the opposing colors so I did not have to explain much. Usually I am against putting sources directly on my infographic, but I think they added a little balance to the graphic itself and there was no confusion on where I got the information.
