
By: Rachel Iredale

Reflection
Program:
I originally used Excel because I have used this program before. I did not like the design options in Excel so I decided to try Canva. Canva has many more designs that are much more pleasing. I used a template for both graphs but made them my own by changing the colors, words, fonts, and font sizes. I really liked how easy it was to use this program to make well designed graphs. You simply enter your information and Canva does the rest. It also has many design options that take your graphs from bland and simple to pleasing and creative.
Research and Timing:
I research voting 2020 statistics into Google. It was harder than I anticipated. There are many statistics out there on the 2020 election that go into great detail. It was actually difficult to find general statistics. I visited multiple websites to find the information I was looking for which took about an hour to find solid information that I was able to make a graph of. From there it took about 15 minutes to create each graph.
Design choices:
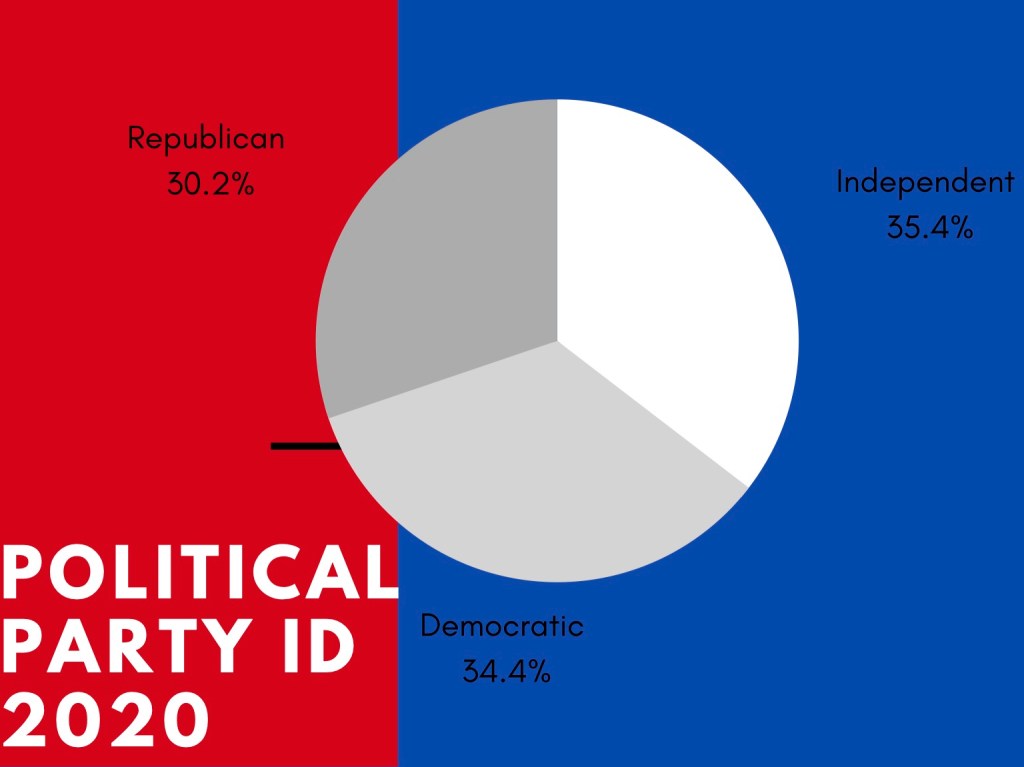
I decided to use a pie chart for the political identification parties because they are in percentages and each section is a piece of a whole. There were also only three sections which makes the pie chart easy to read. I decided to use a bar graph for the percent of each race/ethnicity that is registered to vote because it easily compares the amount of people in each race that is registered just by looking at it. For the colors I decided to use red, white, and blue to represent the political parties in the United States. I also chose professional looking fonts because this is a serious topic and I believe that using a more fancy font would not go with the overall theme of the graphs.
