


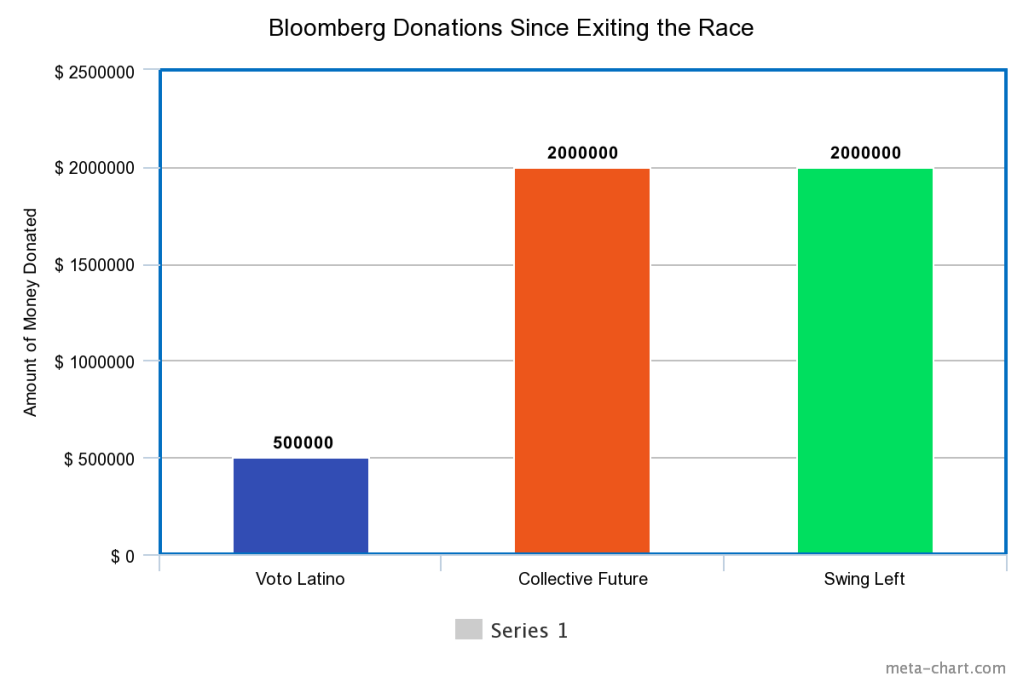
The program I used to create my graphics was meta-graph and PowerPoint. It allowed me to take the graphs and arrange them while adding to them. I thought the article was well written but the parts I used the graphics for were to highlight what was being said. I feel a visual can help with some of this which makes it all easier to understand instead of just reading words that can become very confusing. I created these graphics based on the articles given to me. I found this very simple to do with this article which is why I chose it. It’s also a hot topic being talked about and I wanted to show case something that people are following
