
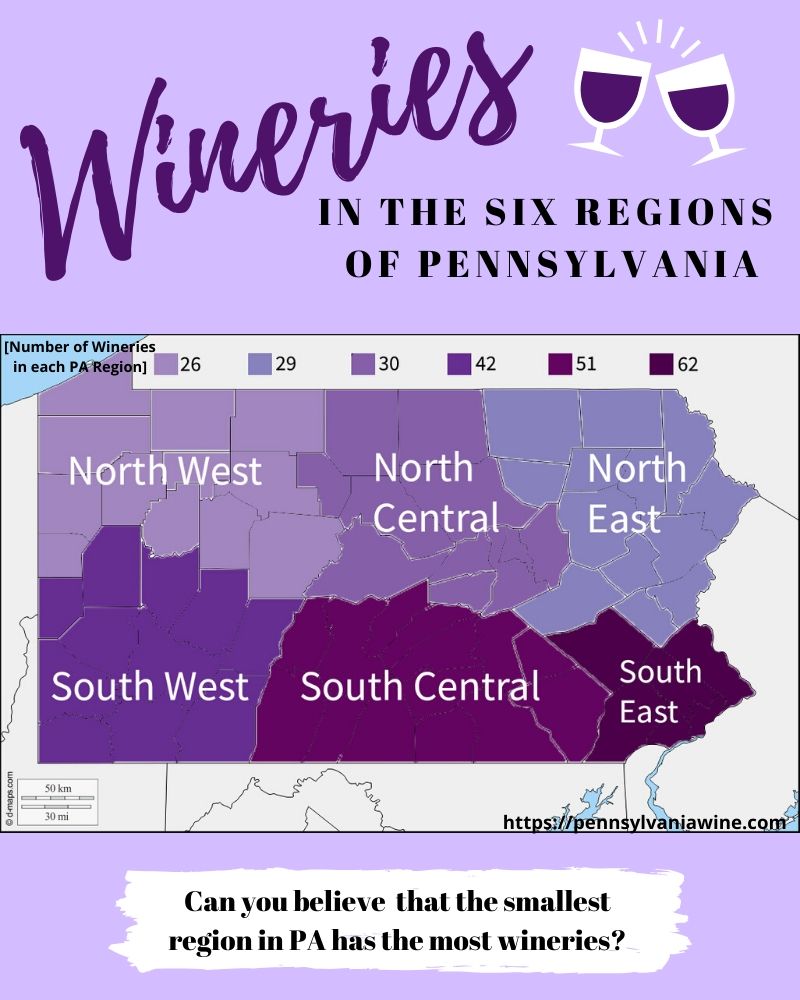
I found that creating the map for this week’s assignment was a lot more enjoyable than last week. Although I really appreciated getting to learn how to make a map on Google Maps, I am much more comfortable using softwares like Canva and Photoshop to be more creative. To start the process of this map, I had to decide on a topic. I recently went to a winery called Spring Gate with my mom that is located near Mechanicsburg, PA. Going to this winery got me thinking about how many there could possibly be in Pennsylvania. I did about a half hour worth of research using https://pennsylvaniawine.com/ and https://www.pennsylvania-vacations-guide.com/pa-counties.html. The Pennsylvania Wine website helped me to know how many wineries are in which region and the PA Vacations Guide helped me know which counties are in which regions.
From there, I found a blank map of PA with the counties on it and uploaded that into Photoshop. I used another map that had the counties labeled to help me know which colors to drop into which counties. First I decided to use different variations of purple because when I think of wine, I think of purple. Then I used the Quick Selection tool in Photoshop to select individual counties to then drop the shades of purple in with the paint bucket. Overall this process took me about 40 minutes because of how time consuming it is to go back and forth with the dropper, the selection tool, and the colors. Once I finished color coding the entire map, I created a key based on the regions and also labeled them.
Finally I uploaded my map into Canva to make it look more like an infographic. I made the background a pale purple and added clipart wine glasses. I made my infographic have custom dimensions of 800px by 1,000px so that it was not too long. Lastly, I added a fun question to engage the viewers of the map to look closer at the full picture. Overall, I enjoyed this week’s task.

Great post 😁
LikeLike