
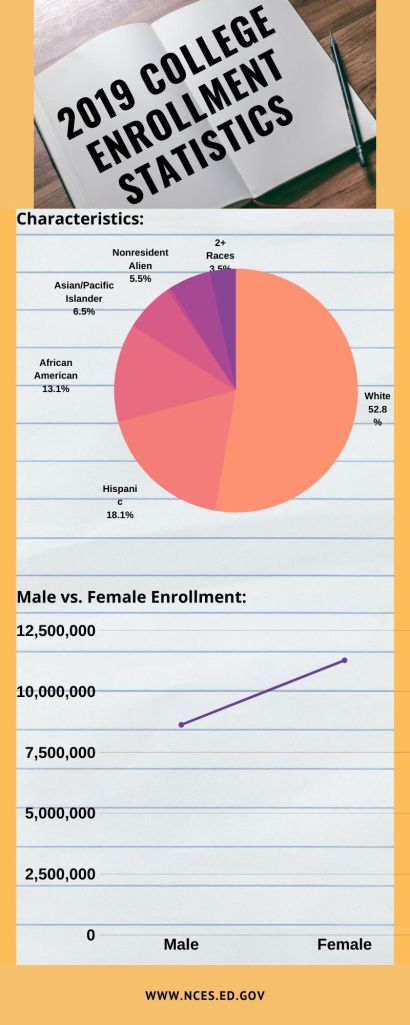
For the second set of charts and graphs I decided to stick with the same topic I chose the first time and try to improve on it. I created both using canva.com. I tried to design the infographic to look as if it was school related to capture the setting of things. I found the information at https://nces.ed.gov/fastfacts/display.asp?id=372 and it didn’t take me long to find the rest. The site made it very accessible which was helpful.
