
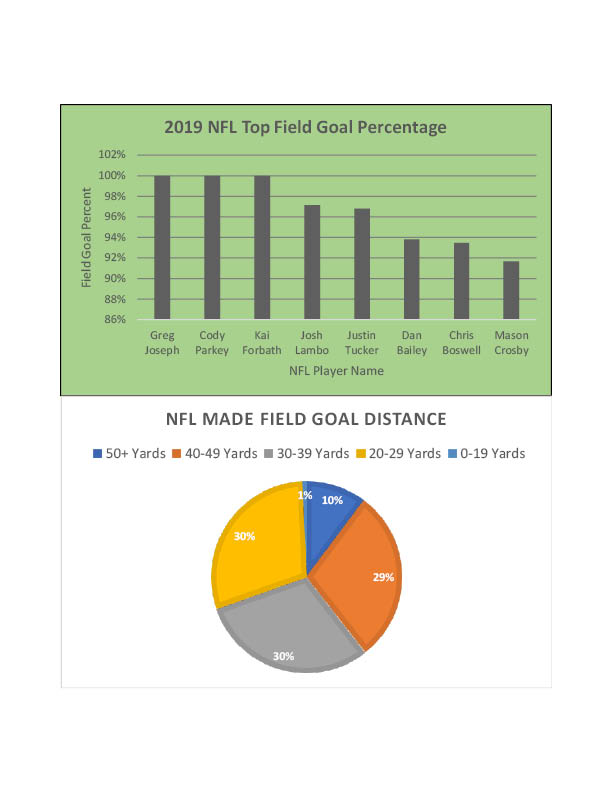
In order to create my infographic I used the program microsoft excel. This program made it very simple to create a bar graph and pie chart, but converting it to a jpeg was not as easy as I expected. Next time I would avoid using excel simply because I needed to put the graphs into inDesign then download it as a jpeg which made my information and numbers blurrier than how they looked on excel itself. In order to research this topic I used a sports analysis website which gave all statistics to the NFL and many other sports for the 2019 season. Researching and creating these graphics took around an hour in total because of the trouble I was having using the databases given and finding a topic on them that I was interested in. I used the color in the first graph to resemble a football field color but had to use conflicting colors in the pie chart because of the five different sections that needed coloring.
Source:
“NFL Player Stats – Field Goals Made, 30-39 Yards.” NFL Football Player Stats & Stats Leaders – Field Goals Made, 30-39 Yards, http://www.teamrankings.com/nfl/player-stat/field-goals-succeeded-30-to-39.
