
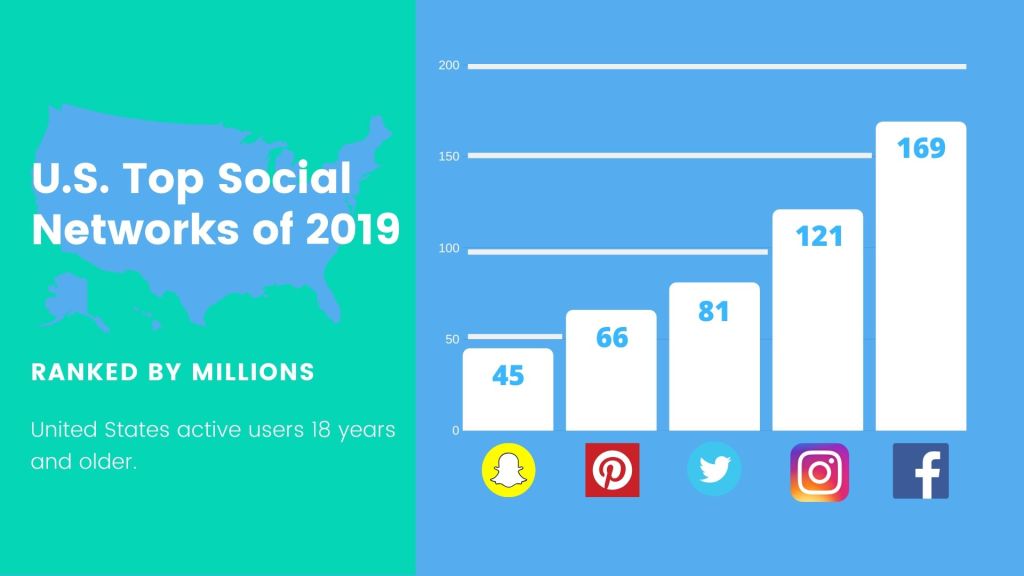
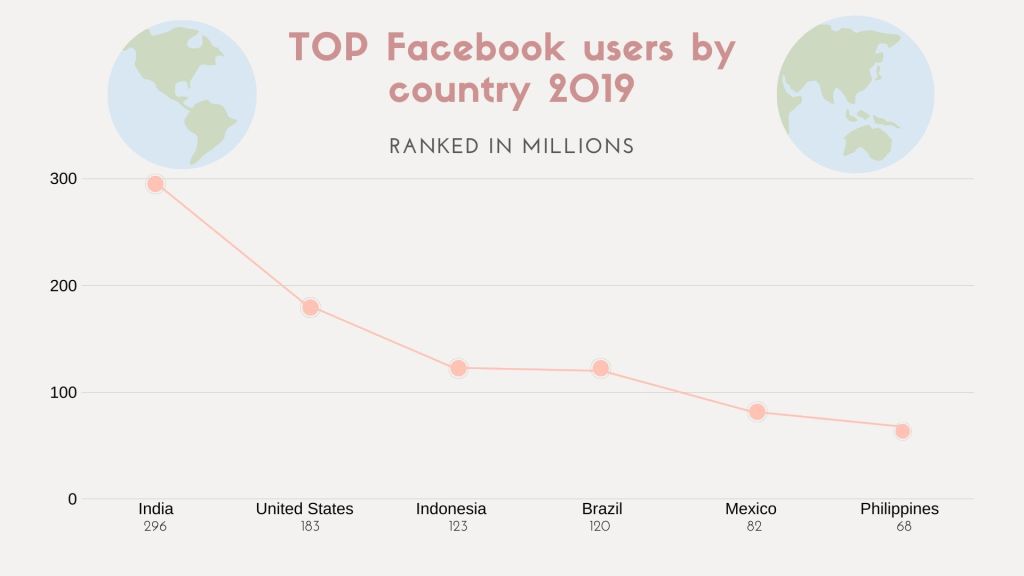
For this assignment, I made both of my graphs through Canvas. My statistics came from https://www.statista.com/statistics/268136/top-15-countries-based-on-number-of-facebook-users/. I did start from scratch with both of my designs. I love using Canvas, the network allows me to make anything I can imagine. Canvas allows me to make any design I want which can result in a cool design. I am interested in social networks so I looked for my statistics on Google. This project took me a week since I originally designed two graphs on an infographic. For my design process, I thought I’d make two completely different designs that have different colors, script, and photographs.
