
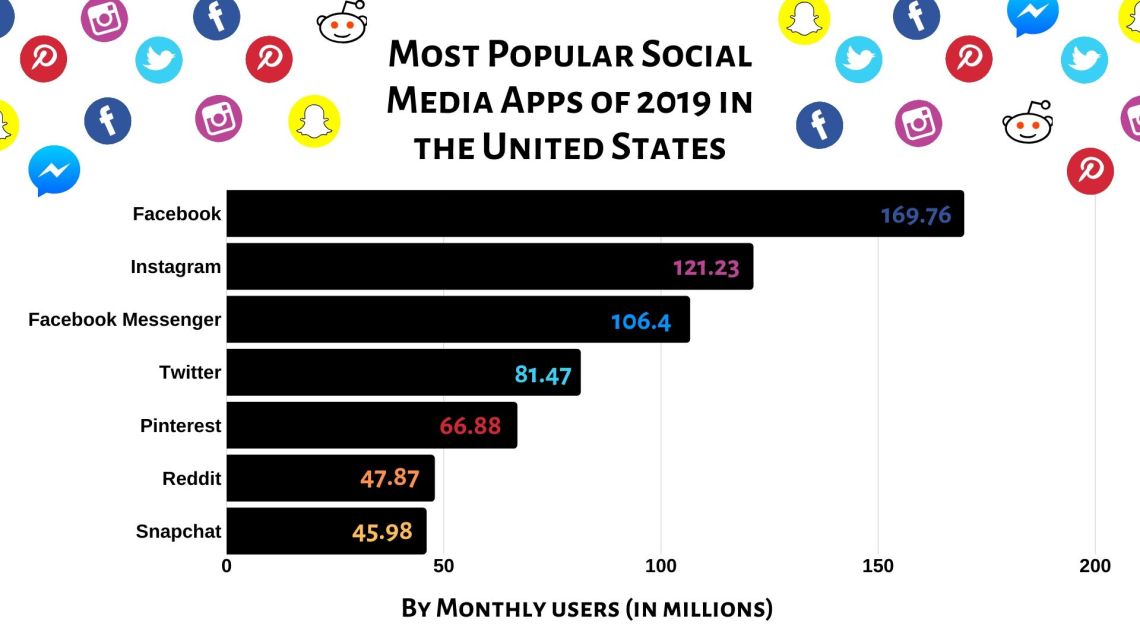
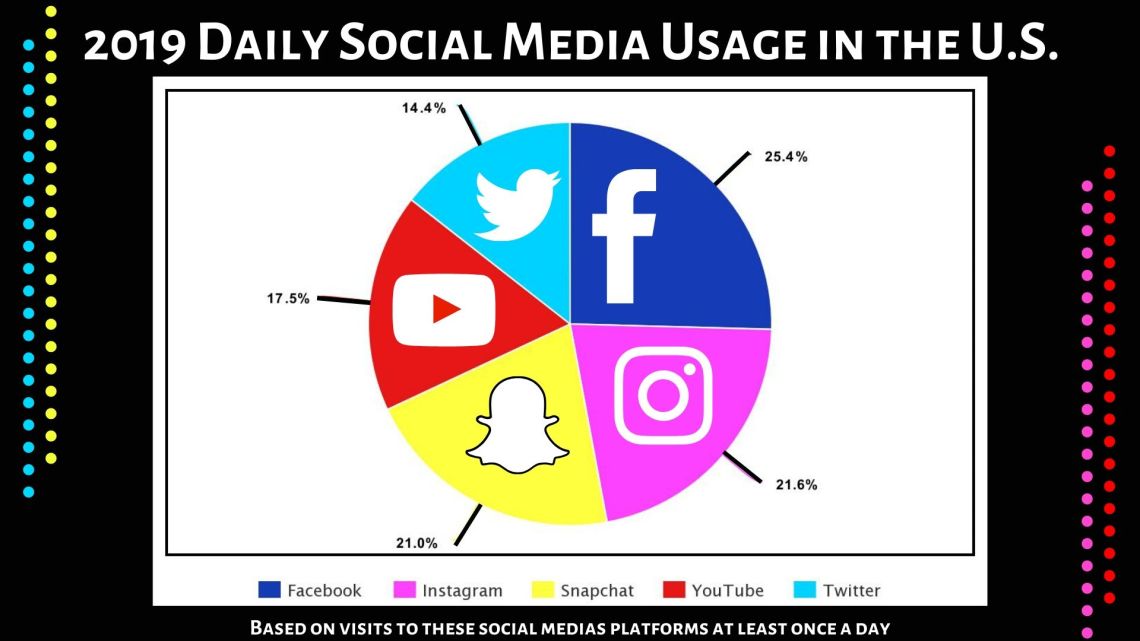
To create these infographics, first I decided to research trends in the media to find out what statistics interested me most. I decided to create two infographics about trends in social media, specifically most popular apps and daily usage. I created these two infographics using Canva.com by starting from scratch. I swear by using Canva to create anything because it is incredibly easy to use and offers so much for no cost. I researched this topic by using two websites: overlo.com and pewresearch.org. I did a simple search for social media trends in 2019 and found some great data to use in my designs. It took me about a half hour to research and approximately two hours to create these charts. I am very much a perfectionist and wanted to make sure they were at a standard I am proud of. I came up with these designs strictly through trial and error. I started with a plain background: black on one and white on the other. I then made the charts by using the chart features that Canva provides, changed the colors, and added all of the necessary information. I then added my personal touch to it with labels, fonts, clip art images, small details, and lots of color to make it pop. I wanted to keep the background colors simple so that I could add the vibrant colors that each social media platform associates with. I am really happy with my designs and think that these charts are easy to read and understand.
10 Social Media Statistics You Need to Know in 2020 [Infographic]
