
Reflection
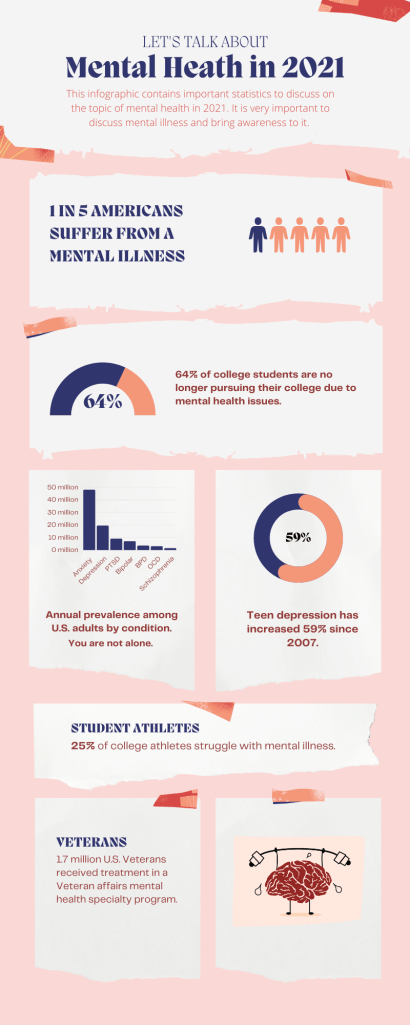
I used Canva to create this infographic. I decided to use a template for this infographic because I liked the colors and the layout of the template. I like this program because I have a lot of freedom to make the infographics my own without it being too challenging. I researched this topic by searching for mental health statistics in 2021 and found two websites with reliable information which I used to create my entire infographic. It took me about a half an hour to research my information and figure out what information I wanted to use. It then took me about an hour to create my infographic and get everything placed and designed where I wanted it. My design process began with choosing a template that I felt like best fit the topic of my infographic. I then created the charts and graphs to represent my data. Lastly, I found an image to represent mental health on pixabay.com and added it to my infographic.
