
By Dyllan Ogurkis
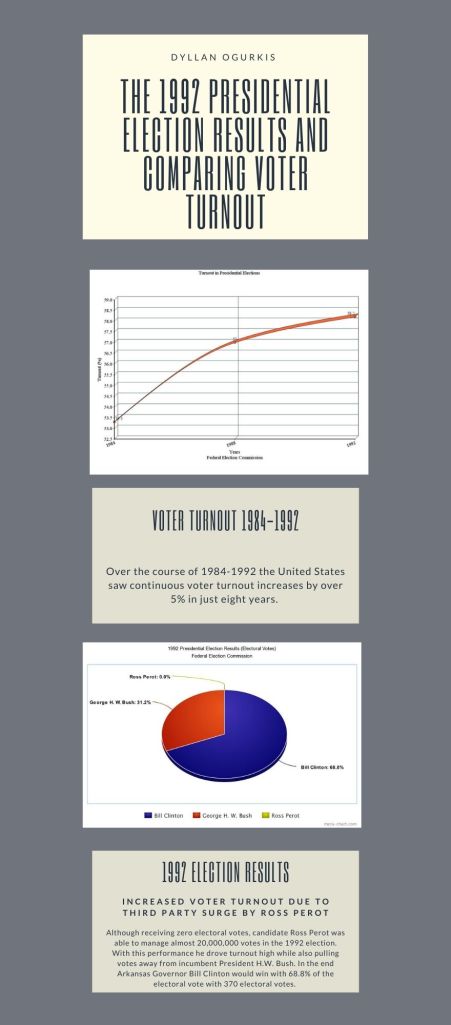
The infographic as a whole, I utilized canva by brining my outside computer generated graphs together with text to describe the numerical findings. All of the data from both the pie chart and bar graph were from the Federal Election Commission. I researched the data by utilizing the FEC website as well as FEC data which chronicled the elections between 1984-1992. Including the unique election of 1992 which featured a relatively strong third party challenger to incumbent President Bush and Gov Bill Clinton. All together the graph creation and data collection took a relatively small amount of time. Finally for the pie chart, I utilized the coloring for pie pieces by political affiliation. Blue for Clinton, Red for Bush, and Yellow for Ross Perot.
