


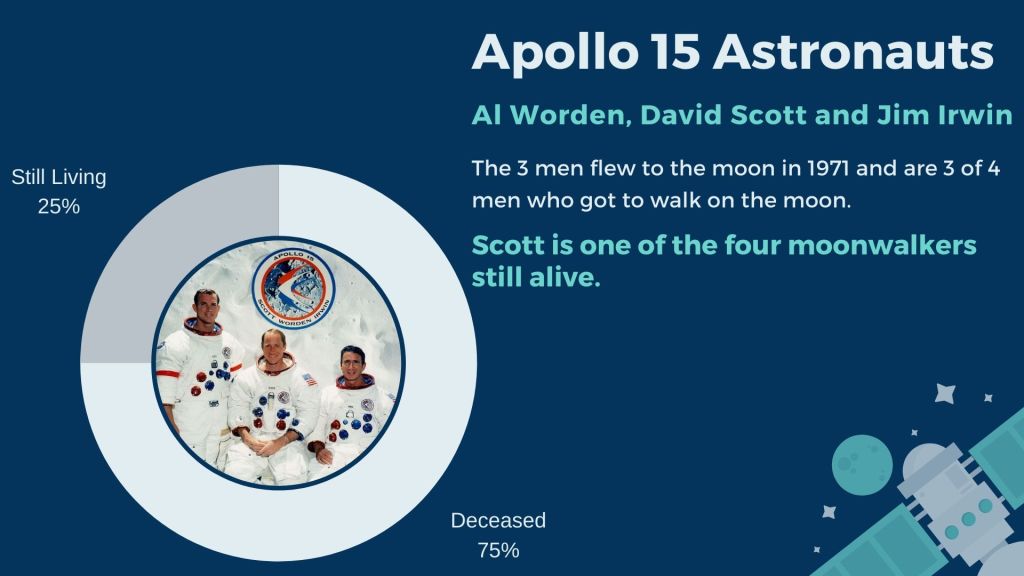
This week’s assignment was a very confusing for me because I had a hard time understanding what I was supposed to do with the stories and how I could possibly make infographics out of them. After reading all of the articles, I chose to do my infographics on the Al Worden topic because I have always been fascinated by space, astronauts, and the science behind it all. I used to tell my parents that because our last name is Astrachan that I was destined to be an Astronaut. This entire process of creating the three infographics took me about 3 hours total because I needed to read all of the articles to decide which one I wanted to focus on in addition to deciding which information I wanted to use. I then went straight to Canva.com as I always do and found these space designs that I altered to my liking. I then picked information that I found most interesting from 4 different paragraphs and decided how I wanted to lay them out. The first graphic is all about the fact that Al Worden did the first deep-space walk and how far away from Earth he was. I chose to include both the Moon and the Earth and added a line to show to distance. I also included his quote about seeing his home because I felt very impacted by this. The second graphic is a timeline of Worden’s time with NASA before retiring to work elsewhere. I used a timeline effect with planets to mark off significant points instead of normal dots. Finally, I created a graphic about the three astronauts within Apollo 15 and used a donut chart to show how many of those that actually walked on the moon are still living (sadly there’s only one). I also included a photo of the three Apollo 15 astronauts to the center of the donut chart so it wasn’t just a boring navy blue circle.
