
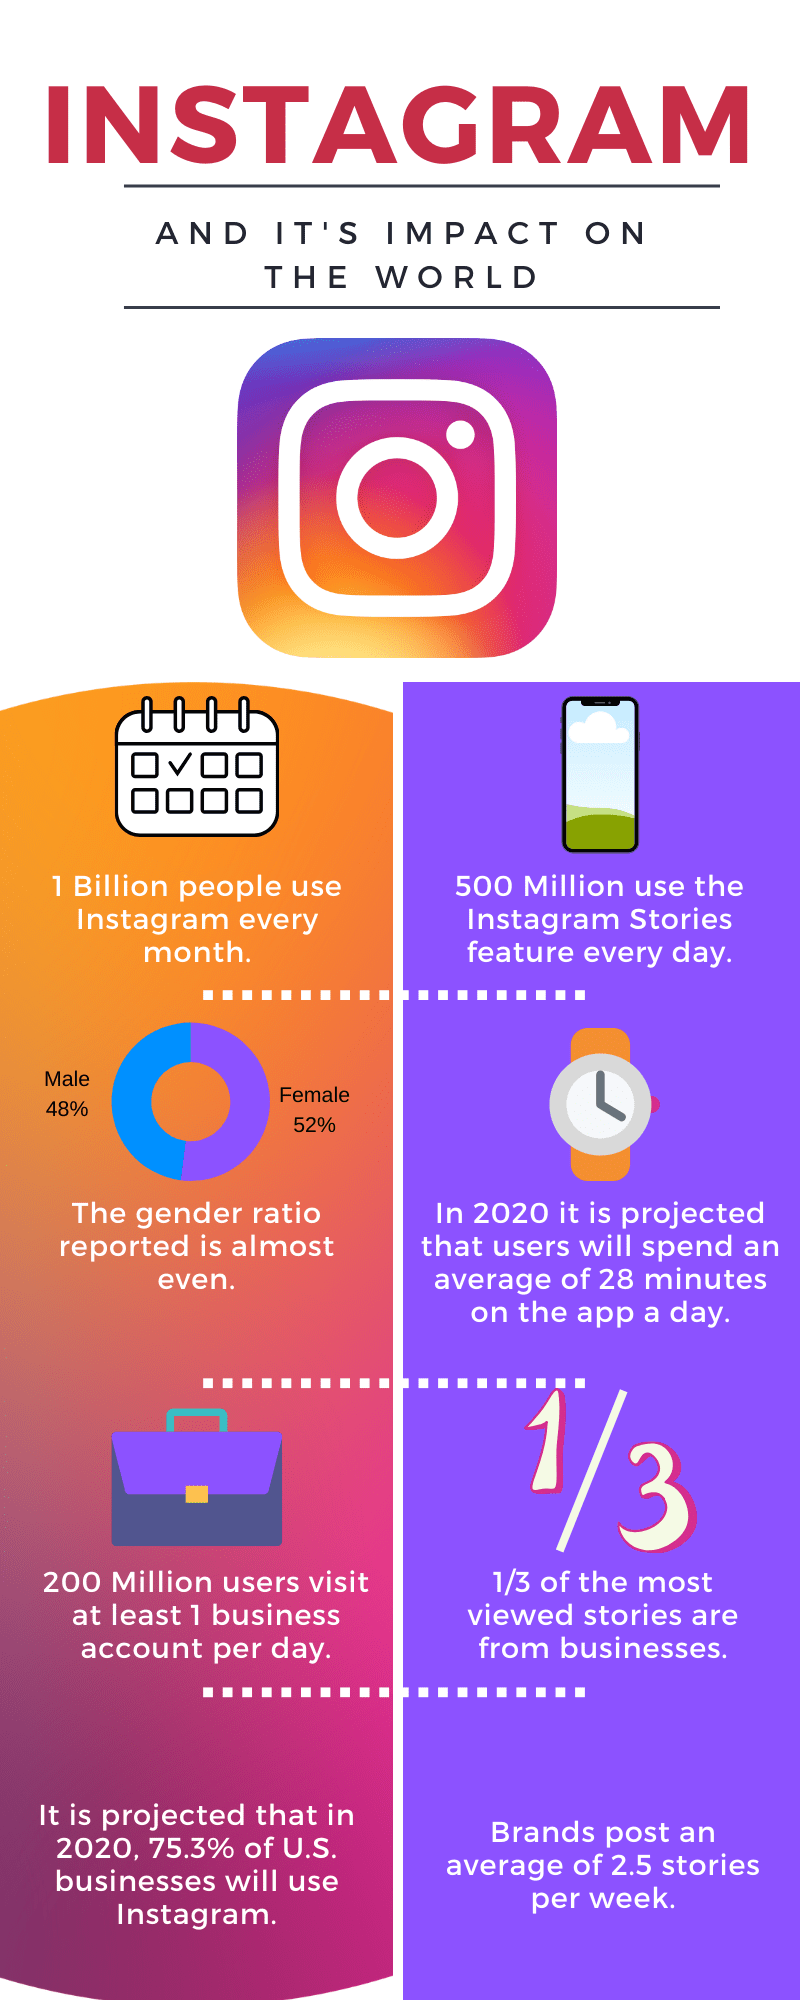
For this infographic based on media and entertainment, I chose Instagram since it is one of the most popular apps in use right now, especially during this pandemic. Instagram’s statistic’s listed in my infographic with projections for 2020 most likely have changed a lot with everyone finding ways to get creative on social media to reach out to others through the power of social media.
I chose Canva to do this infographic because now that I have used it many times, I am enjoying it a lot more. With all of the templates it makes it easier for me to get a foundation for my creativity and it is always easy to make it my own. I spent about 30 minutes on this one because I had an easy time finding statistics and just used the rest of the time to get creative.
