
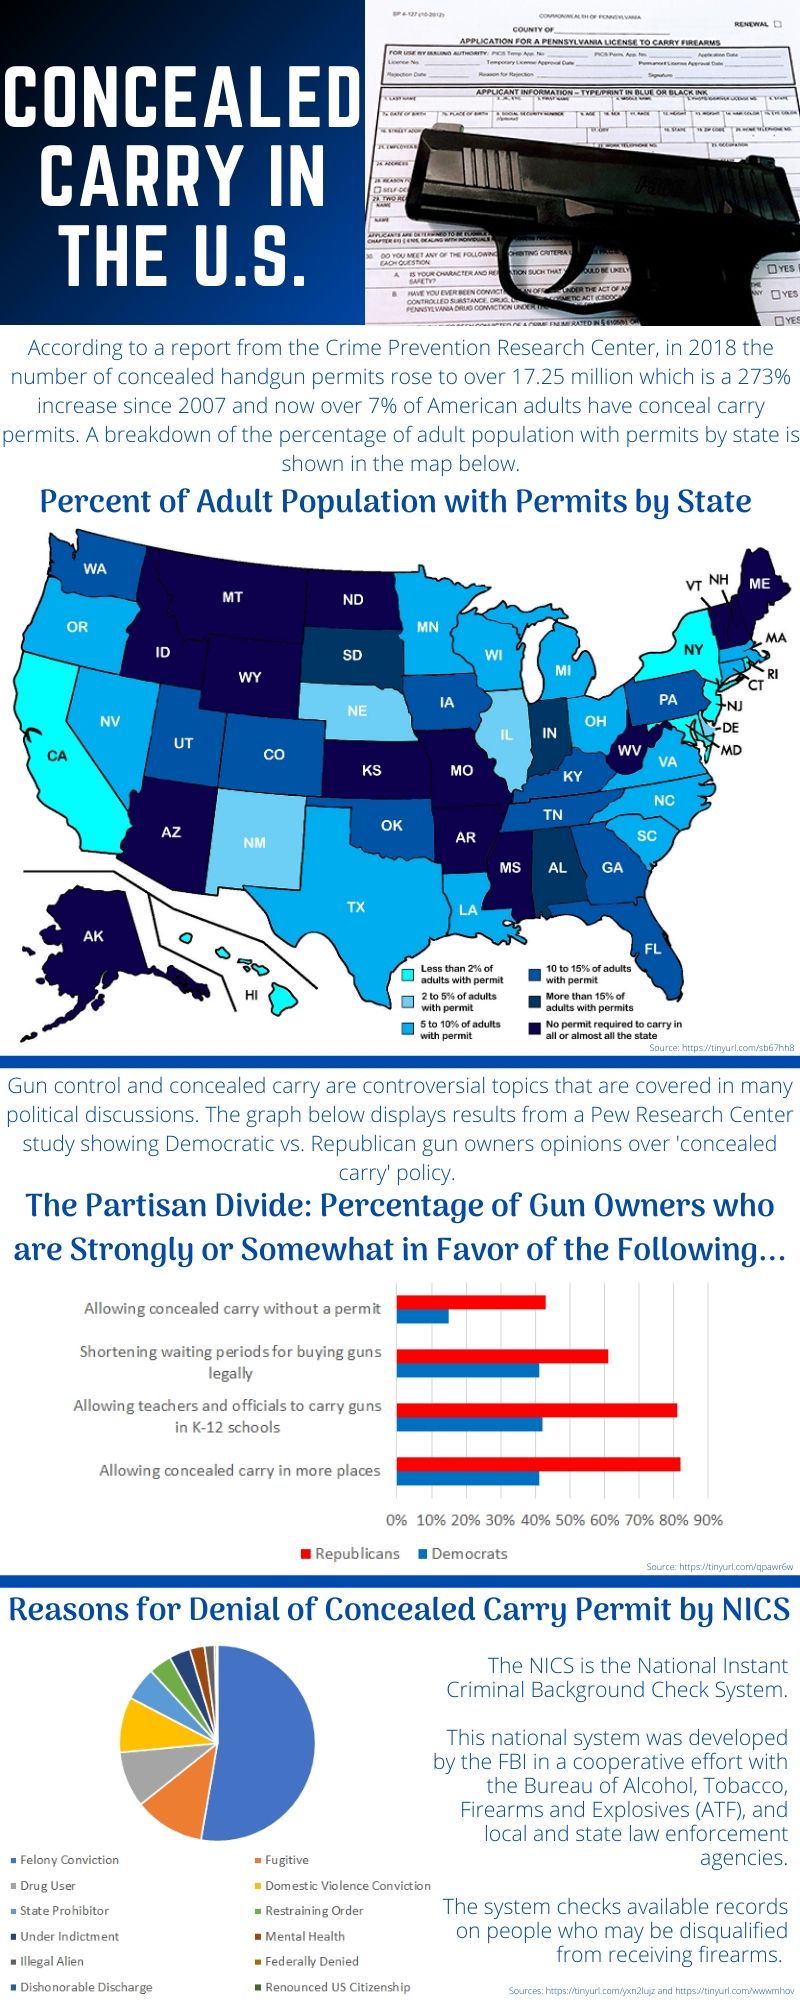
This week I decided to create my Politics and Elections infographic on Concealed Carry Permits in the United States, even showing how Democrats and Republicans view the policies differently. I gathered my information from multiple sources, cited below and on the infographic regarding concealed carry permit holders per state population percentage, percentages of Republican and Democrat gun owners who are in favor of various policies, and reasons why people are denied their concealed carry permits in NICS criminal background checks. All the information I read was so informative and great to learn about especially since I interested and applying to get my concealed carry permit myself. I would say it took me approximately an hour to research and decide on what information I wanted to include in my infographic and narrow down statistical findings to include.
I created my infographic on Canva and made it from scratch. I created my choropleth map in Photoshop and my bar graph and pie chart using Excel and then placed them into Canva and added text to further explain where the information came from and what information was displayed in the graph, chart, and map. I downloaded a free blank labeled map of the United States and opened the image in Photoshop. I then used my quick selection tool and went through each of the states and colored them according to the measurements set forth in the Crime Prevention Research Center’s report. I labeled each of the states after filling them with their colors and created a key in the bottom right hand corner. I made Excel sheets for the information presented in each my bar graph and pie chart and then created the chart and graph. I made my bar graph colors red and blue to represent the Democrats and Republicans. I made my pie chart multiple colors to show variation in the slices because when I originally colored the chart variations of the color blue, all the blues flowed together, and it was hard to decipher which color went with which label. With the multiple colors in the chart, it was easier to differentiate each labeled section in the key.
I chose the main color blue for a unique reason, when thinking of concealed carry, I think of the blue jeans that help hold and conceal the carried firearm. Seems silly but I found it to be logical at the time of choosing my infographic theme and colors. I also went with the color blue because law enforcement and police officers help enforce the concealed carry permit requirements and policies. As for the picture I included in the top right-hand corner of my infographic, I took it myself. That is my personal firearm that I legally own and I printed out a blank concealed carry permit application for the state of Pennsylvania. To be creative, I placed the firearm on top of the blank application. Overall, it took me approximately 5 hours total to create this infographic. The choropleth map took a big chunk of the time up due to selecting each of the 50 states individually and filling in the colors, touching up edges, relabeling each state, and then creating the key.
Information Sources:
About NICS. (2016, June 23). Retrieved from https://www.fbi.gov/services/cjis/nics/about-nics
Higgins, P., Woodward, M., & Owens, S. (2019, April 6). Concealed Carry Statistics: Quick Facts by State (2017). Retrieved from https://www.gunstocarry.com/concealed-carry-statistics/
Lott, J. R., & Wang, R. (2018). Concealed Carry Permit Holders Across the United States: 2018. Crime Prevention Research Center. Retrieved from https://concealednation.org/wp-content/uploads/2018/08/SSRN-id3233904.pdf
Parker, K., Horowitz, J. M., Igielnik, R., Oliphant, J. B., & Brown, A. (2019, December 31). Guns in America: Attitudes and Experiences of Americans. Retrieved from https://www.pewsocialtrends.org/2017/06/22/americas-complex-relationship-with-guns/
