
 This assignment had my brain thinking A LOT. I felt there was so much I could do I just didn’t know where to start. I recently completed a LinkedIn Learning course on making infographics using PowerPoint so I decided to use it this time around. My topic of choice this time, the female reproductive system; more importantly the issues that can come along with it.
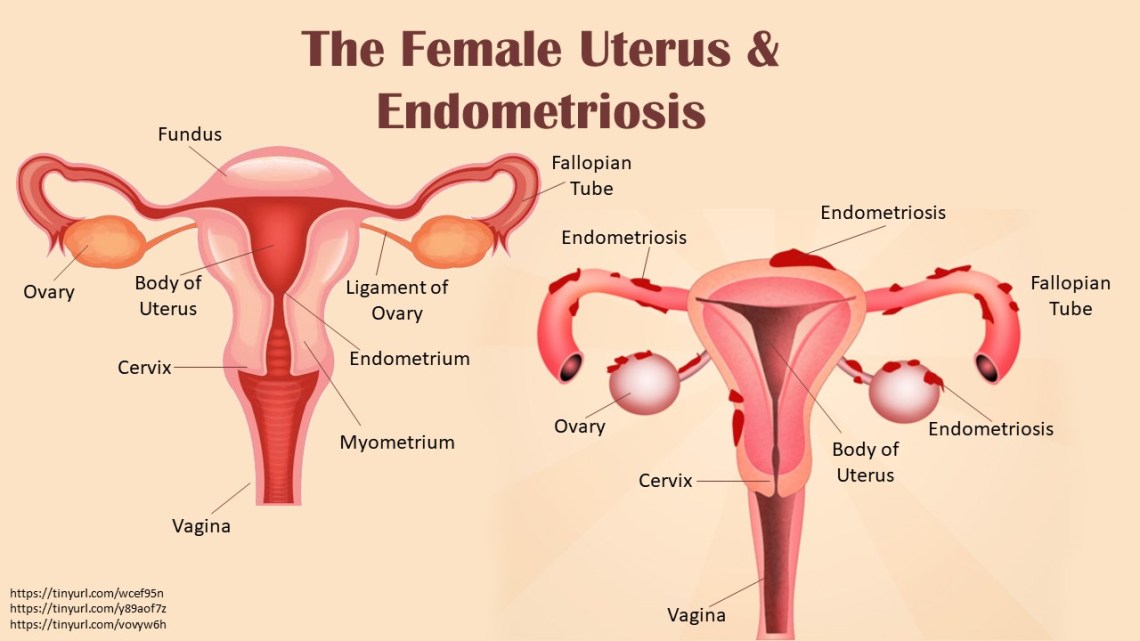
I started out with just labeling a normal uterus and all it’s parts. After that I put the same uterus, but with a disorder known as ENDOMETRIOSIS. This is when tissues that would naturally line the uterus begins to grow on the outside. It affects 1 in 10 women and all during their reproductive time. The red blotches represent the spots of endometriosis on the uterus.
Overall this assignment was fun and not stressful like the last one. I will definitely be using PowerPoint for more infographics.
