
For this infographic, I wanted to choose something with a lot of statistics. Since the topic of marijuana is so sensitive and sensitive, I thought it would be fun to present on. Another reason I chose to do this because of the color theme it lended in itself. Green plant, green money.
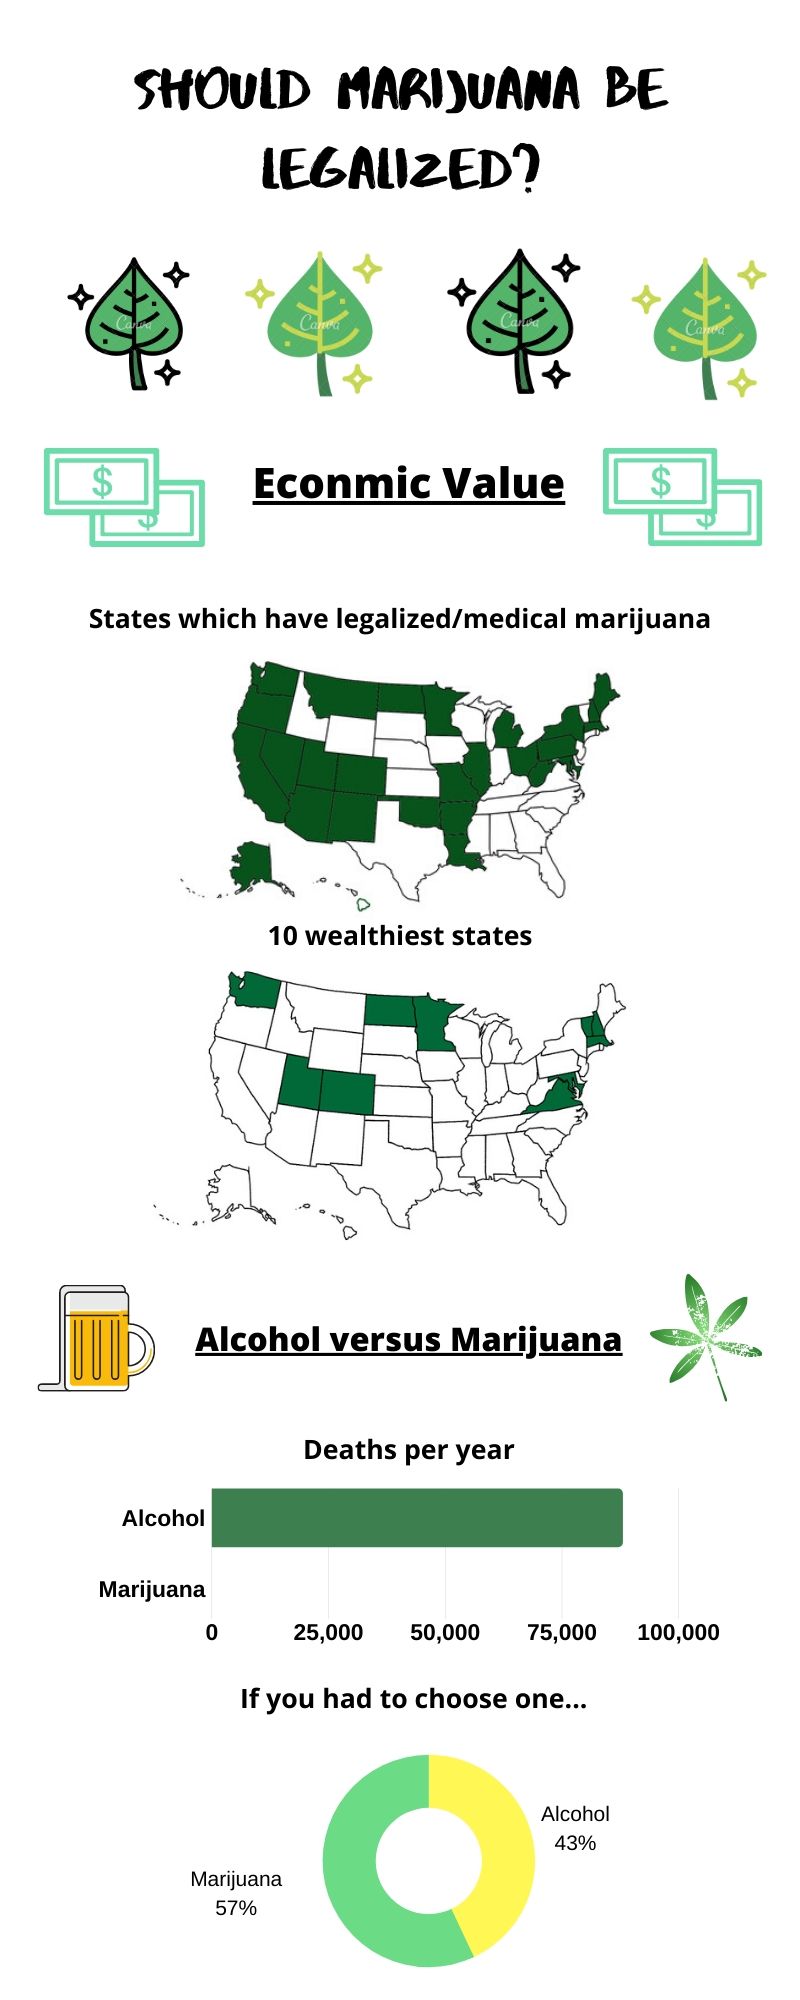
I decided to use Canva.com again because I have really grown to love and get comfortable with it. I researched this topic all week in order to figure out what statistics I really wanted to present. I came up with these three things.
I think this time around I had a much better idea on what was expected from me. I also started to get more comfortable with the task of visually representing data which I know is extremely useful.
For my sources, I used the following websites:
10 Richest States in America, States Where Marijuana is Legal, The Great Debate: Alcohol vs Marijuana, and Americans’ Perceptions of: Alcohol vs Marijuana.
