

Let me tell you, this time around these graphs got me FRUSTRATED. I chose to use two different programs from the resources menu on Bolt. I used Chart Chooser and the Online Chart Builder. These two programs seemed great in the beginning; very simple and basic procedures. But once it came time to export or save these graphs, it became a whole other story.
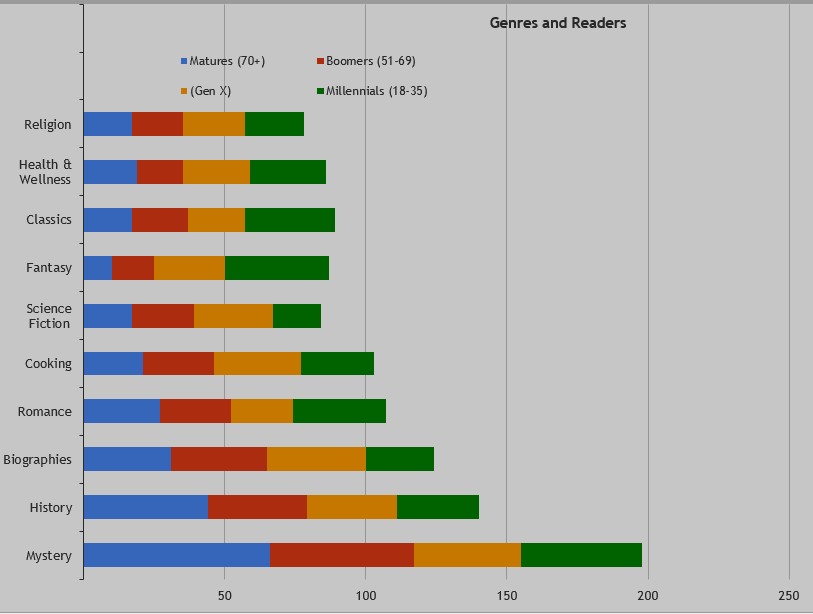
I chose to look at the comparison between book genres and what generations are reading said genres. For this graphs I used to a regular bar graph and a stacked bar graph. I felt these types of graphs were great for displaying the data I used. They made the data easy to compare with multiple colors and heights/lengths of bars. It honestly took me forever to do these graphs just because of the exporting process. These programs both require you to save outside the program before being able to insert it in to the blog. With chart chooser, I used a template off the website which then takes you to Excel. Exporting off of Excel is something I will never try again. It was very annoying.
Over all this time around was hard for me but I got the job done. Hopefully with a little more practice things will become second nature.
