
For the first two graphs and charts I had to create for this class, I stuck with Film and gathered information off the interesting topic of Box Office Income and wanted to see if there was indeed a rise in Films hitting the Billion dollar mark.
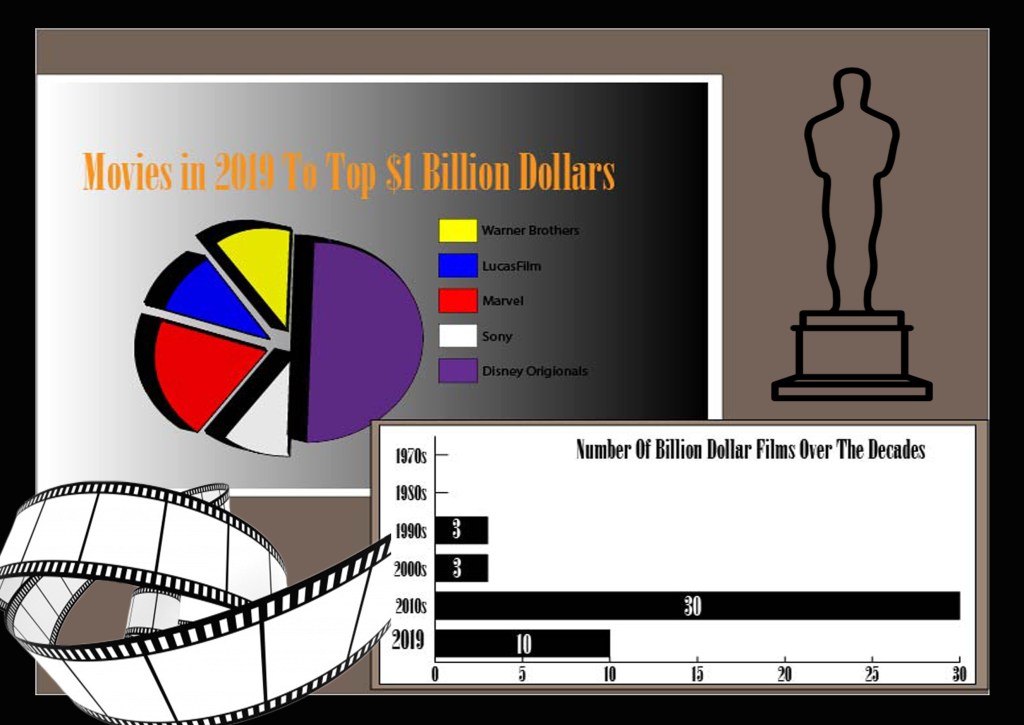
As many movie goers know, 2019 was a big year for films with 10 of them forgoing the $1Billion. Some of them include Joker, End Game (which beat out Avatar for the All-Time Box Office crown), Frozen 2, etc. However, I had to compare this past years success to other years and found out through sites like Insider, Forbs and Entertainment Magazine, that there have only been 46 films to hit the Billion, and nearly a forth of them came this past year. In fact, It is a third of what the 2010’s produced in total.
Lastly, I had to take into account with the next graph of what companies produced the most Billion dollar films of 2019, and with no surprise, Disney came out on top with 5 films. However, I know what some may be thinking, Disney owns Marvel and Lucasfilm… Though, they are separate companies themselves. So in retrospect, Disney “owned” companies produced 8 out of the 10 films to conquer the Box Office.
Overview/Sources:
Insider: https://www.insider.com/highest-grossing-movies-box-office-2017-1
Box Office Mojo: https://www.boxofficemojo.com/year/2019/
I originally made the graphic in Illustrator using both the Bar Graph Tool and the Pie Chart Tool before switching it over to Photoshop to add picture elements. *I was not 100% sure how to insert images to Illustrator so I feel the conversion diminished the quality of the product* I added a 3D element to the Pie Chart and felt the need to add numbers on the Bar Graph for the decades. Overall, I liked doing this project and compiling the data that goes along with it.
