
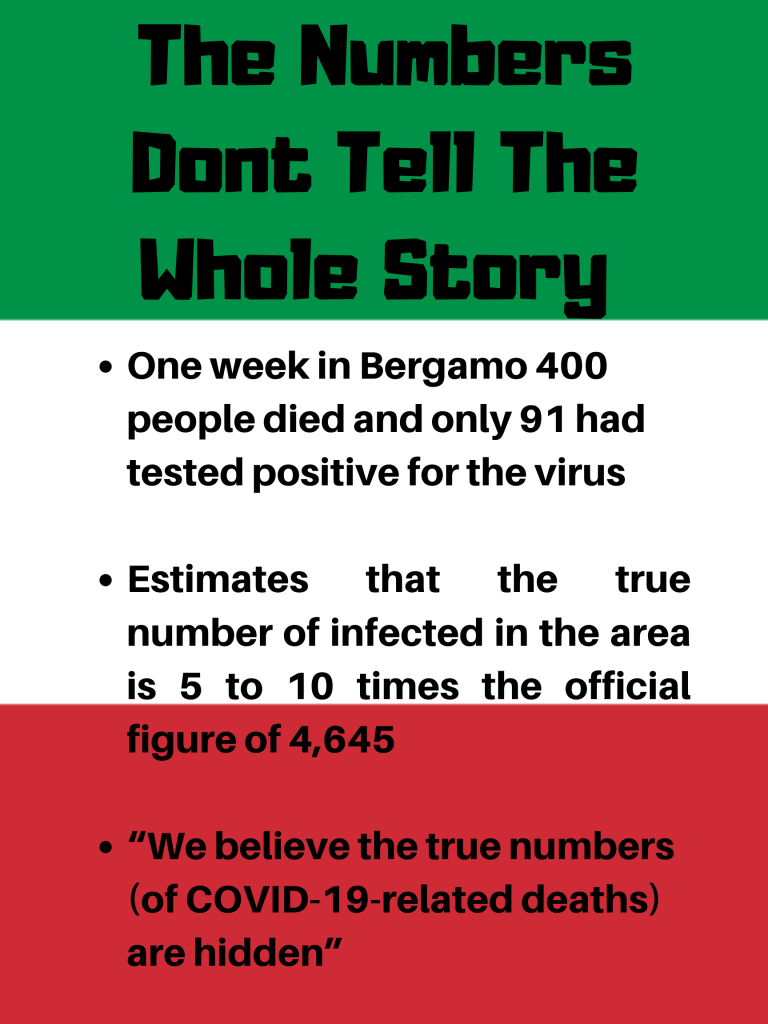
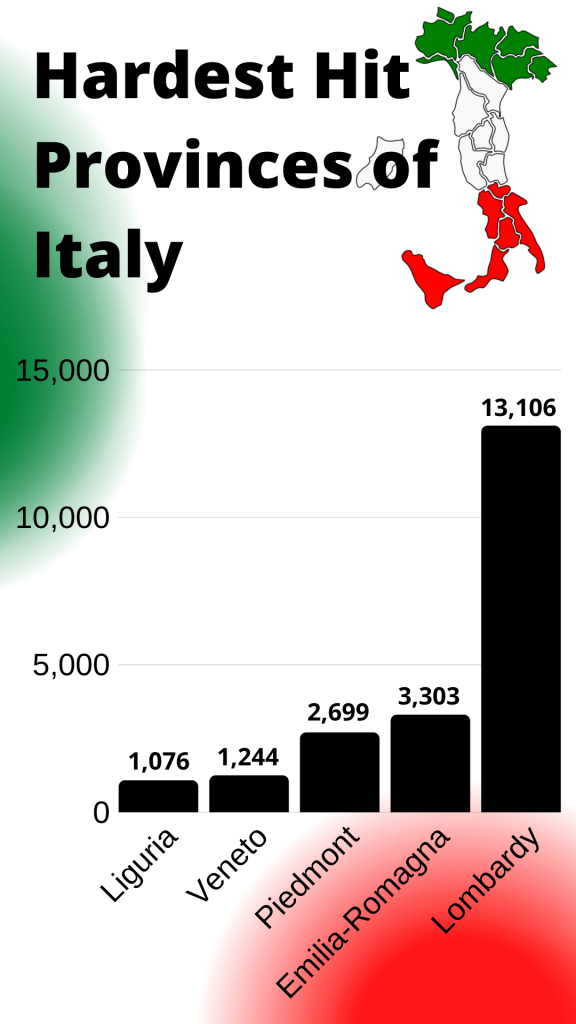
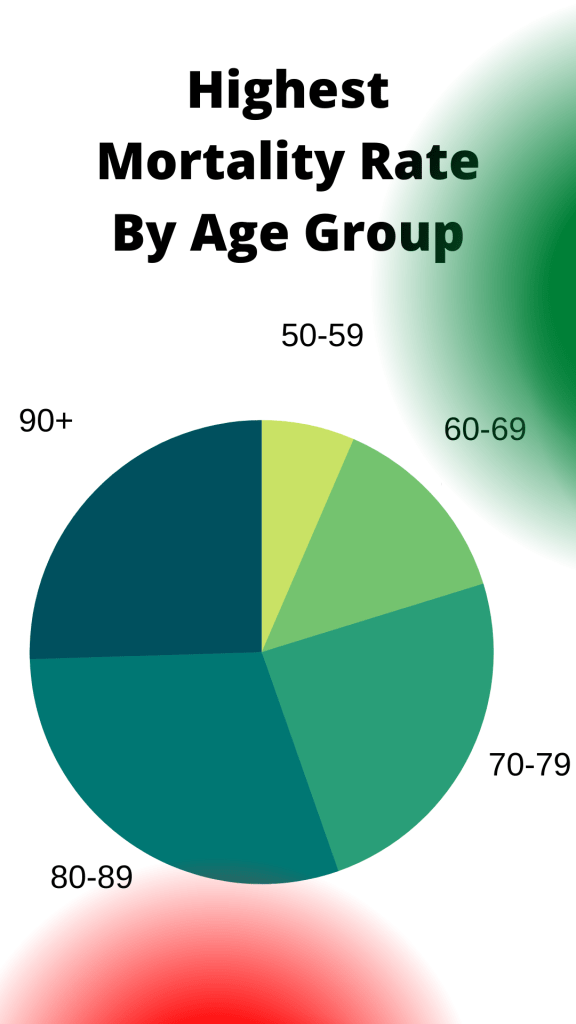
I used canva in order to create this infographic I used 3 white templates and created these graphics from scratch. Canva is a very easy and simple program to use because of how simple it is to work and edit. I researched this topic by reading the article provided then researching information about the corona virus in Italy. Overall I spent an hour researching this topic and then an hour creating these infographics. I decided to use the colors of Italys flag in order to add color to these infographics and make them stand out. The poster reflects number 7, 8, 18 Bar chart reflects 2 and pie chart reflects 26 and 3.
