
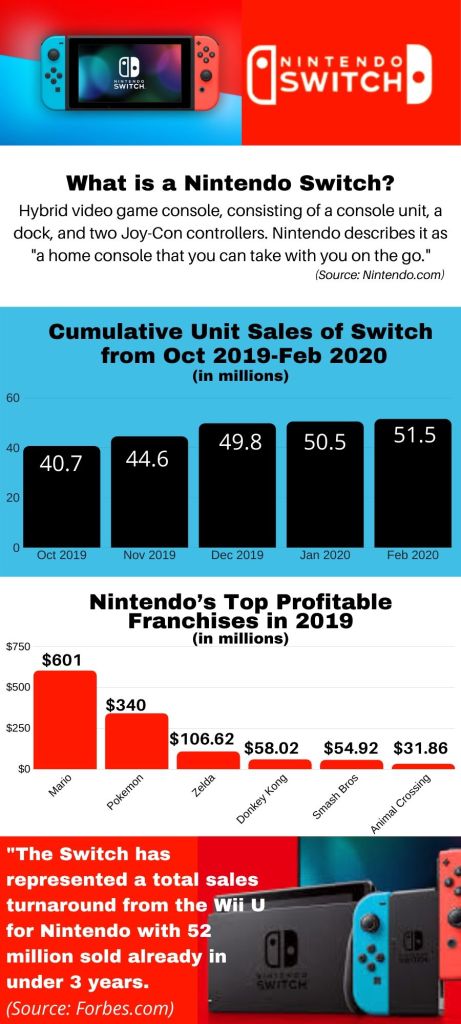
For this week’s infographic assignment, I decided to do mine on the Nintendo Switch. I chose this topic because my dad and I recently splurged on one for quarantine entertainment and we have been obsessed ever since it came in the mail. From racing in Mario Kart to chasing bananas in Donkey Kong, we can’t get enough of our fun new toy! This entire infographic took me about two hours because I had a lot of trouble figuring out how I wanted to lay everything out in an appropriate manner. I chose the color scheme of red, blue, white, and black because these seem to be the standard colors that are associated with the Switch. I knew I wanted to start off with a short description of what a Nintendo Switch is and I found that off of the Nintendo.com website. I then was curious to know how many units have been sold in the last year, so I did some research and found a helpful article from Statista.com that told me statistics of units sold from October 2019-February 2020. Then I decided to look into the top games that people were buying. As a new Nintendo Switch owner, I am finding myself obsessing over getting and playing new games. I found another article on Statista.com that told me a ranking of the top games and I made it into a bar chart. Finally, I decided to add in a little fun fact about the Switch compared to another Nintendo platform called the Wii U that I found from Forbes.com.
