
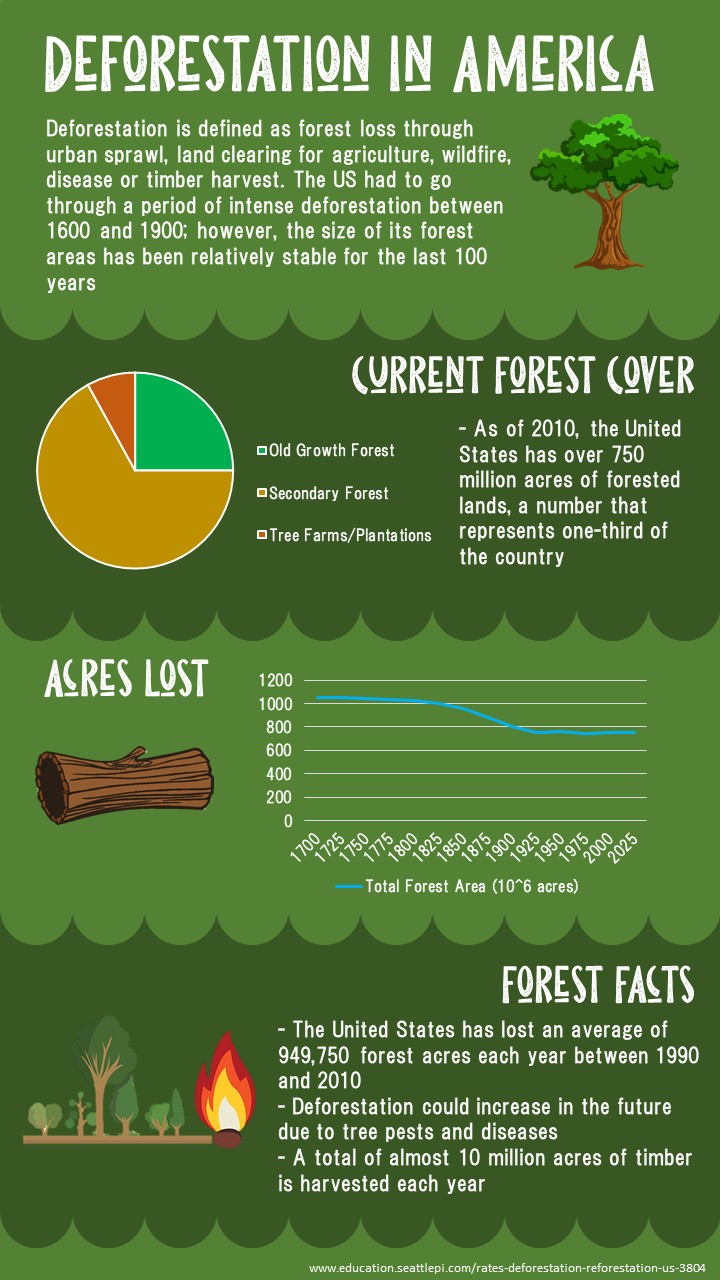
I decided to take a different route for the design of this infographic from what I normally do. The two green colors contrasting for the panels was really eye catching to me, and I thought adding the half-circled borders gave it more authenticity. I created a majority of the infographic on Photoshop while making the pie and line graphs on Microsoft Excel. I downloaded a specific font called “Pine Forest” from Dafont.com to use for the headers on each panel. This font had a look to it that was perfect for the subject matter in my opinion. The information for the panels was provided by the link attached while the clip art was obtained through a free image domain. Save our forests!
http://www.education.seattlepi.com/rates-deforestation-reforestation-us-3804
##infographic #deforestation #unitedstates #forests #climatechange #data
