
 This week I decided to create my Health and Environment infographic on Hunting in Pennsylvania. I included information about the Hunter-Trapper Education Course that is required by law to complete in the state of Pennsylvania. This course teaches hunters and trappers how to be safe and ethical when out hunting and trapping. I gathered my information from Pennsylvania Game Commission website and their Hunting License Sales Report that they have on their page. I would say overall it took me an hour and a half to research the information and decide what I wanted to include on the infographic.
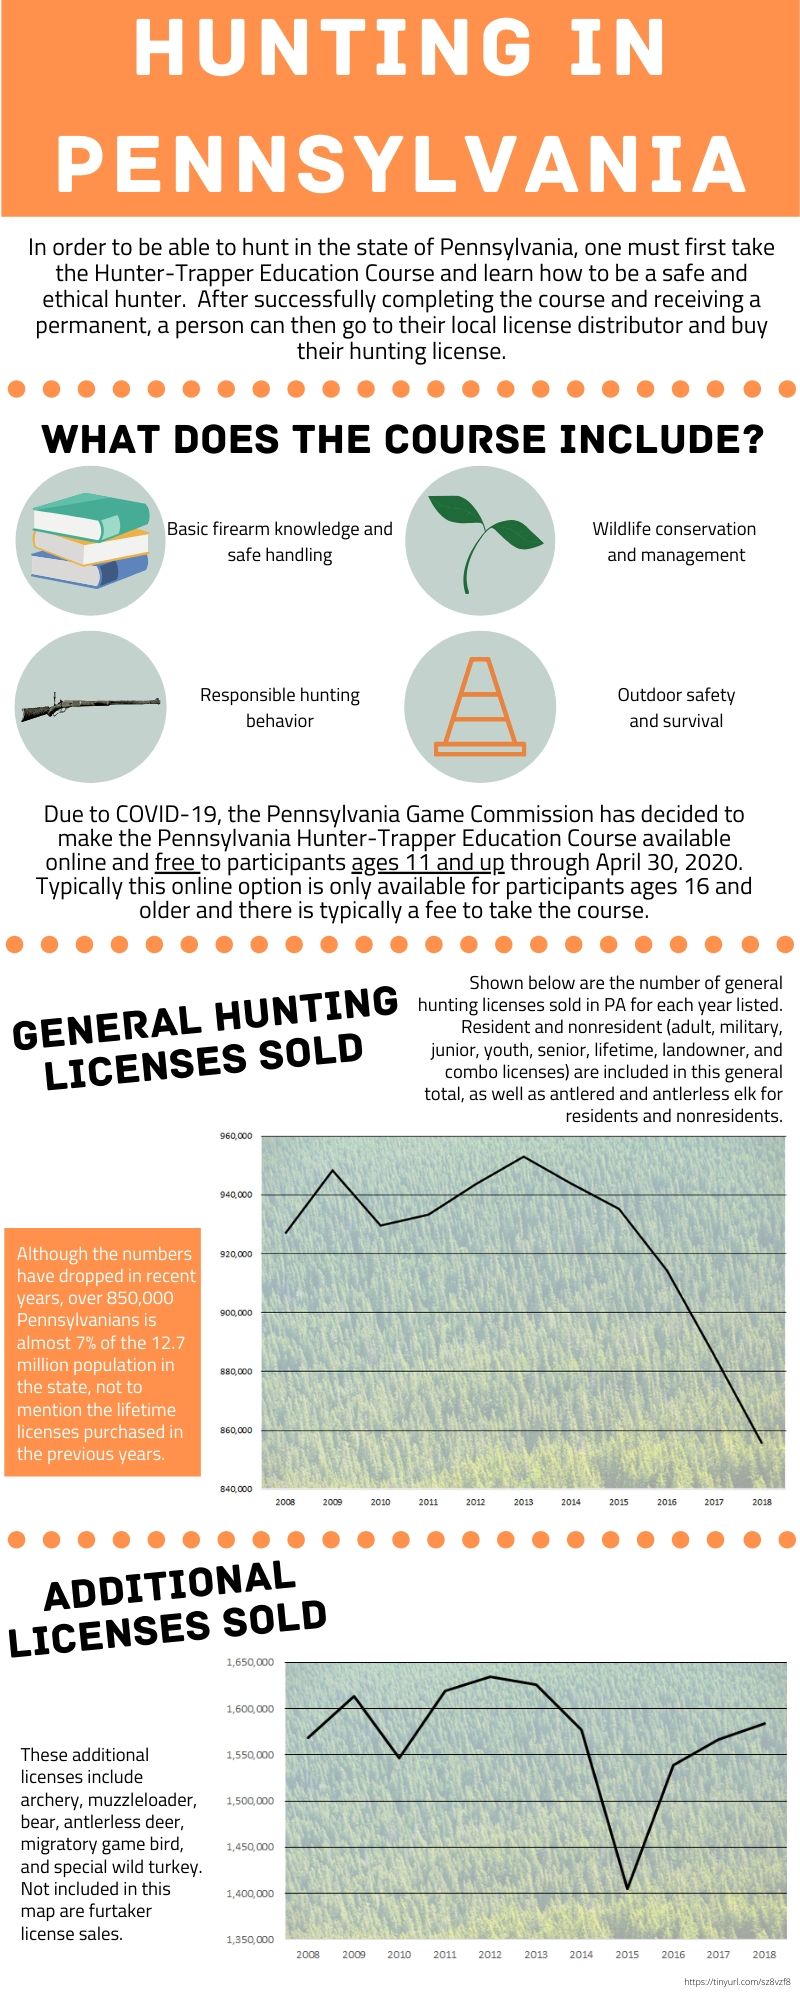
I created my infographic on Canva and made it from scratch. I created both my graphs on Excel and transferred them onto the Canva infographic. When making the graphs I decided to add pictures of woodland area to the background to up the creative edge and also incorporate the photo element to my infographic. I made my graph lines black so they would stand out against the darker colored background, I also faded the color of the free photo used from Canva’s website of the woodland so that the graph on top of it would be easier to see.
For the remainder of the infographic I chose orange as the main color since hunter’s are required to wear orange during specific hunting seasons so that they are seen by other hunters and are recognizable as hunters and not by camouflage. For the icons in the diagram, I chose to use a tinted green that matched the tint of the graphs and chose green because whenever you think of hunting and trapping you think of camouflage and green is involved in that color scheme.
I love hunting and I hope that this infographic informs others that are thinking about starting to hunt to take the Hunter-Trapper Education Course and get their license. I wanted to explain the difference between general and additional licenses and what was included in each so that people would have a general idea of what licenses are qualified under each type of license. I made the graphs showing the data of the number of licenses purchased each year to show how many people hunt in Pennsylvania each year and to show how these numbers have fluctuated over the years. Overall, it took me about 3 hours to fully complete this infographic.
Information Sources:
Hunting License Sales Report. (2019). Retrieved from https://www.pgc.pa.gov/HuntTrap/LicensesandPermits/Pages/HuntingLicenseSalesReport.aspx
