
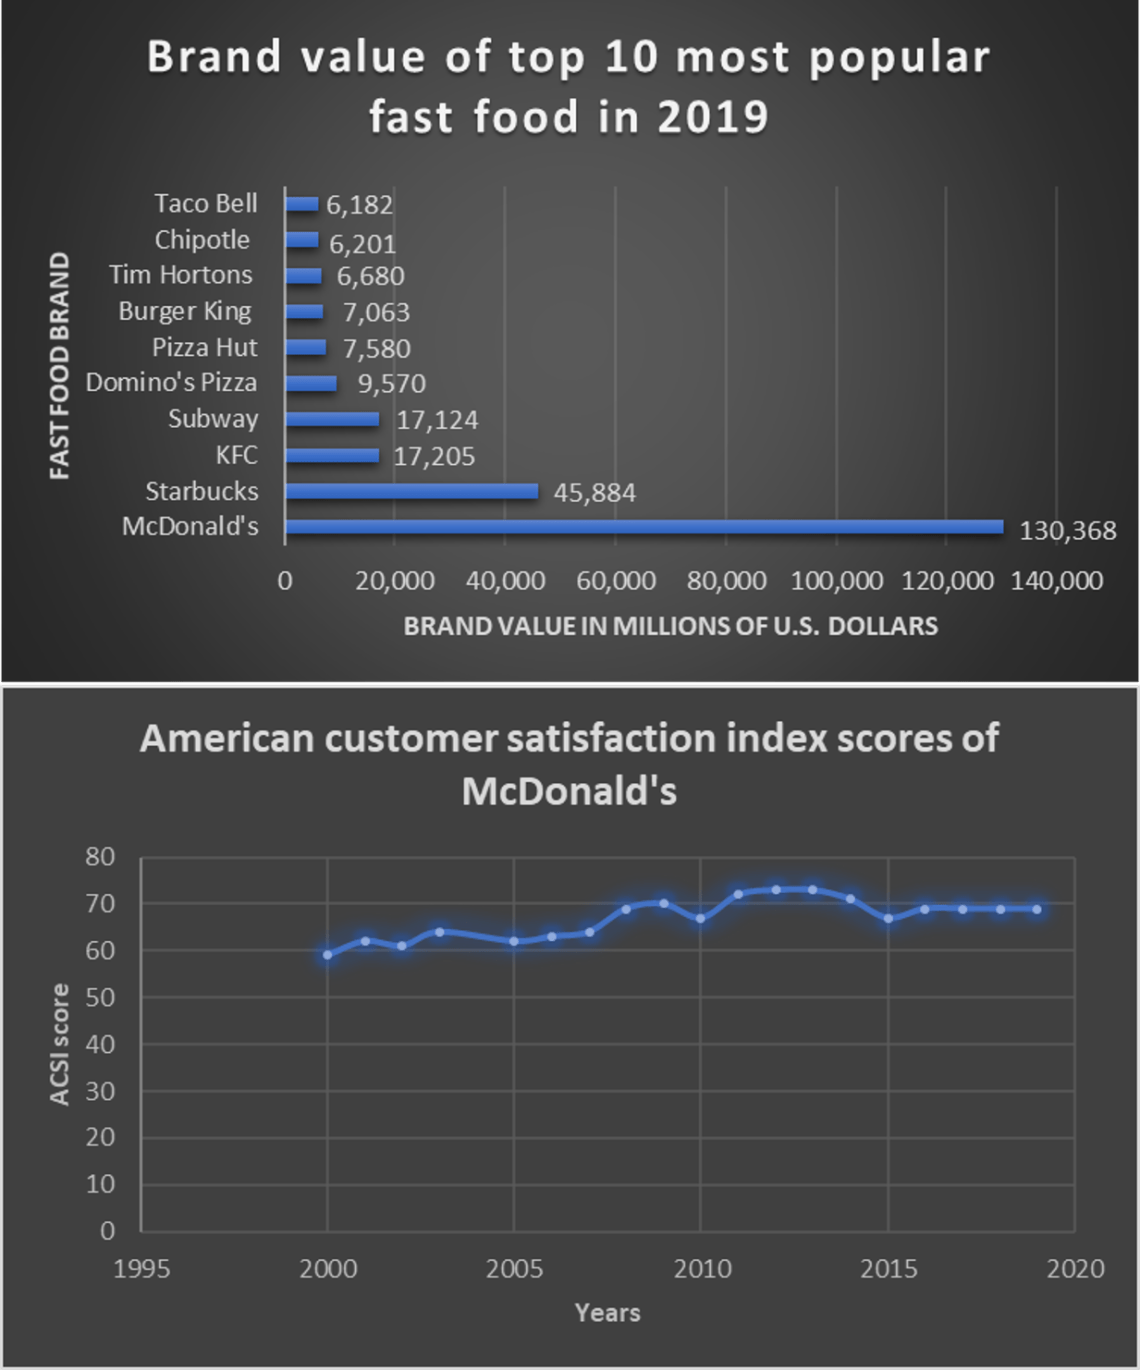
I developed these Infographs through Microsoft Excell. They talk about the most popular fast foods worldwide and also giving the costumer satisfaction score of the number one fast food restaurant in the world McDonald’s. This program allows putting data in to create a graph very simple and I used statista.com to acquire this data. Research and creation of this Infographic took me an hour to complete and was fairly easy. After learning more from the LinkedIn Learning assignment I was able to convert my excell graph to an image with much better resolution and almost no pixelation compared to last time.
