

Reflection
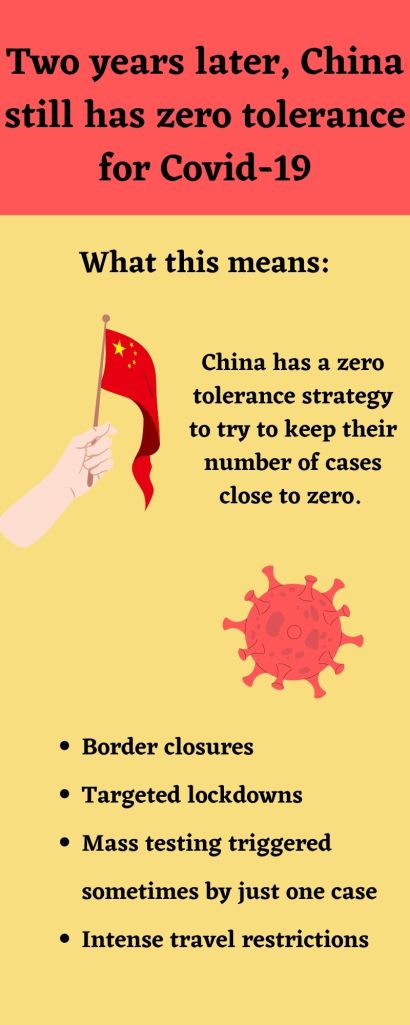
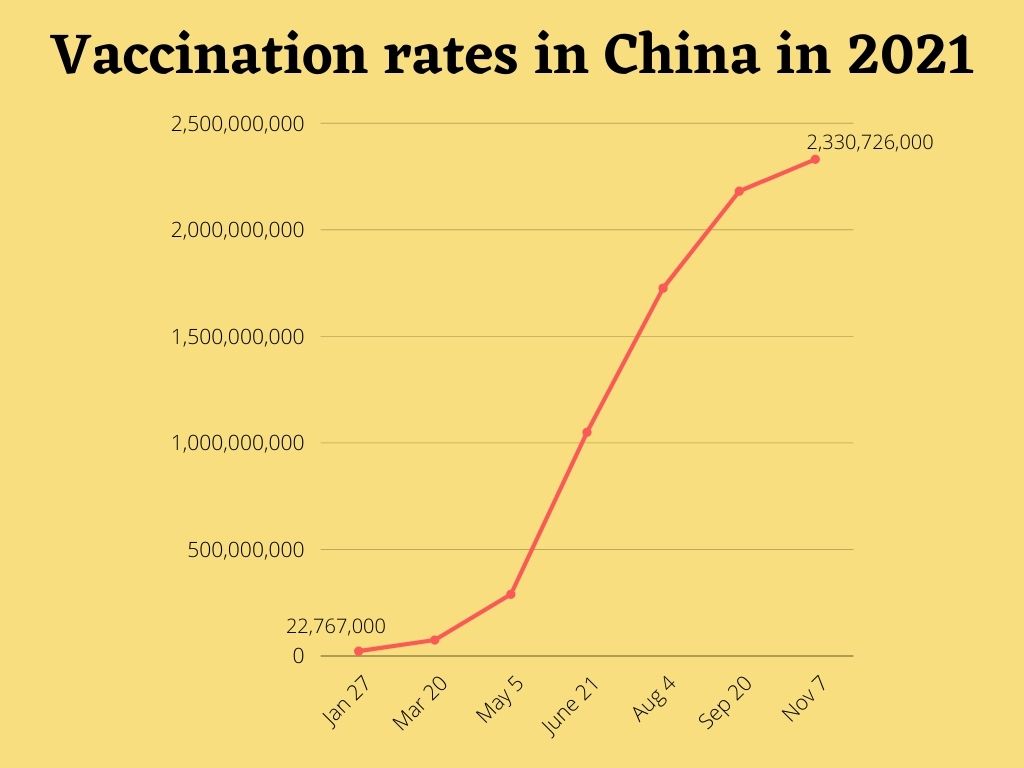
I used Canva to create these infographics. I decided to start from scratch on these infographics so I could have more freedom to make them look how I want them to. The elements of this story that caught my attention were how strict China is about Covid. I knew they were strict to some extent but I thought it was crazy reading that a 21 month old has gotten tested more than 70 times already. I think I enhanced what the zero tolerance policy is in my first infographic and the data points in my other 2 infographics that will help put things into perspective. I researched my topic by reading the article and then researching online more in depth about the policy and specific numbers. It took me about an hour in total to research and create these 3 infographics. My design process started with making sure I had the same colors and fonts for each infographic. I chose yellow and red because those are the colors on China’s flag. I wanted the infographics to be simple but effective and add to the story.
Sources
I used Google statistics for the vaccination rates
