
This week, I decided on a topic pretty quick. However, finding the data was difficult. It was also difficult to decide what to do with the data I did find.
Again, I used canva. I found a template that had the blue color I wanted, and then ended up clearing everything off of it and starting from scratch. I am starting to like finding colors on templates for inspiration, then clearing the template and doing what I want with the colors and font choices of the template.
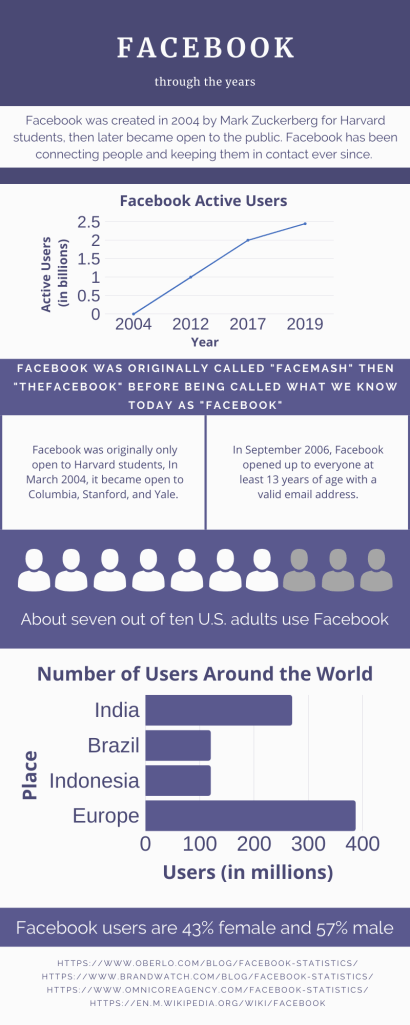
I looked up Facebook data and user information to find my data. It probably took me about two hours to research data while I did the infographic. I decided to add a little more graphics than usual so it wasn’t so text heavy. Overall, I think it went pretty well for how stuck I felt halfway through the process.
