
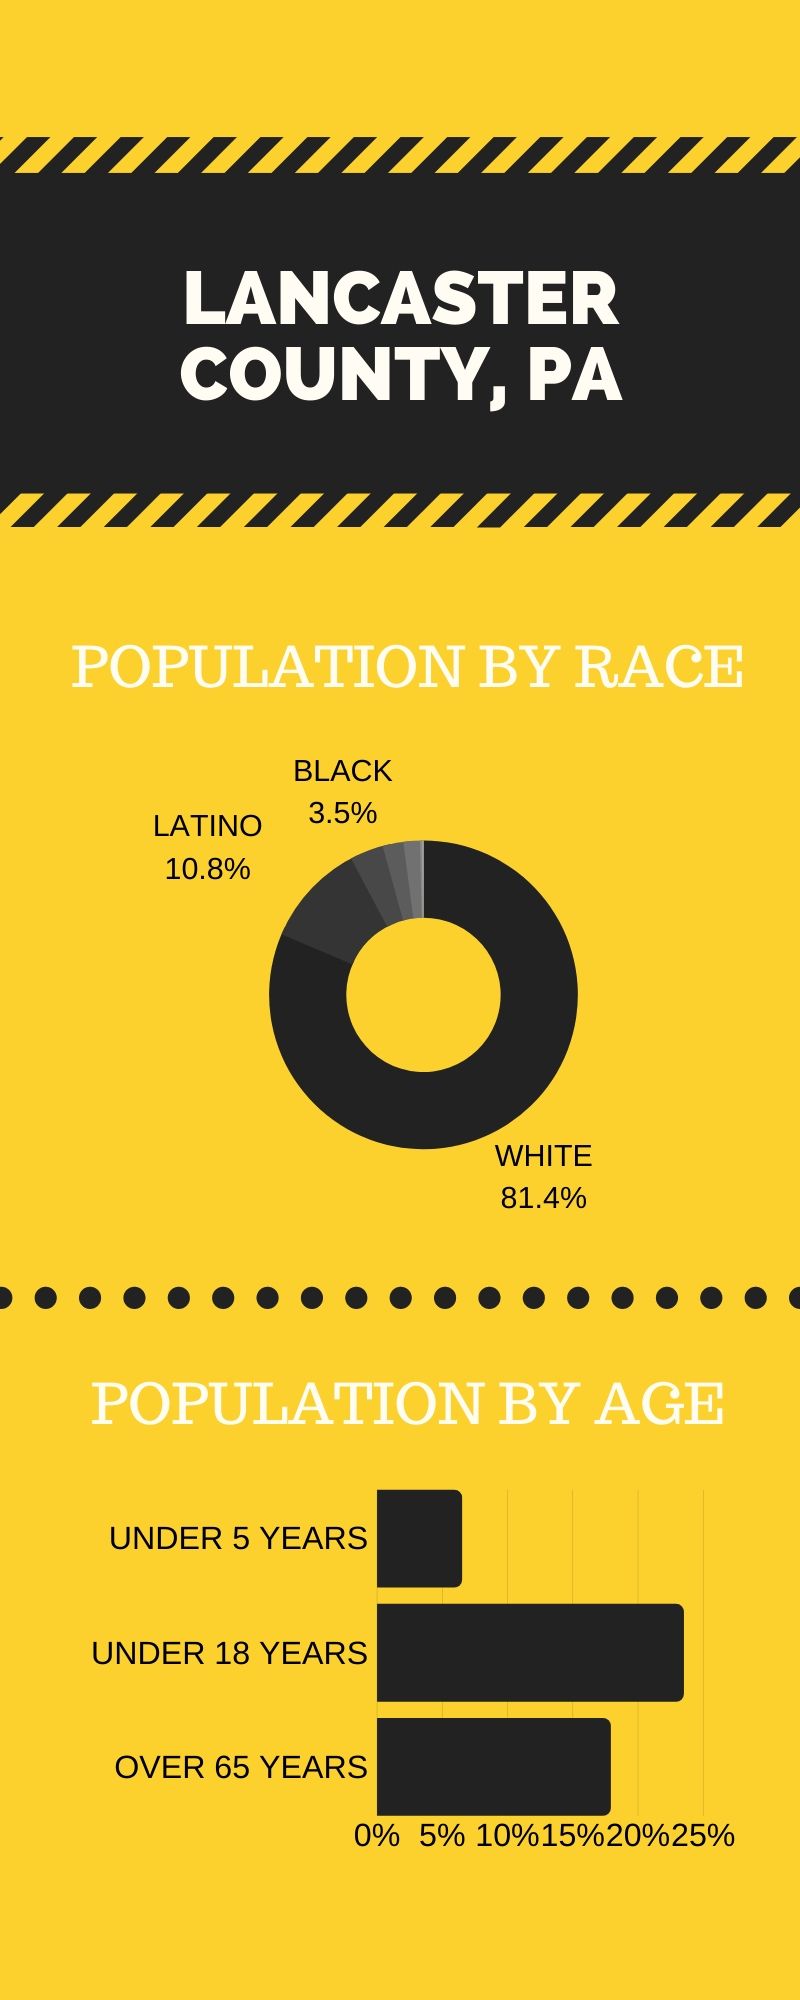
For this infographic, I used Canva again, because this site has so many different templates to choose from, and also lets you customize practically everything on your document. The only thing Canva didn’t let me change was the font for the labels on my charts which was a bit disappointing, but other than that, I enjoyed creating this infographic using the program.
I researched this topic because I thought it was interesting, and I never really took the time to look up this information before. I used the U.S. Census Bureau website to collect my data. I found this infographic very interesting to create, and it only took me about an hour or so.
